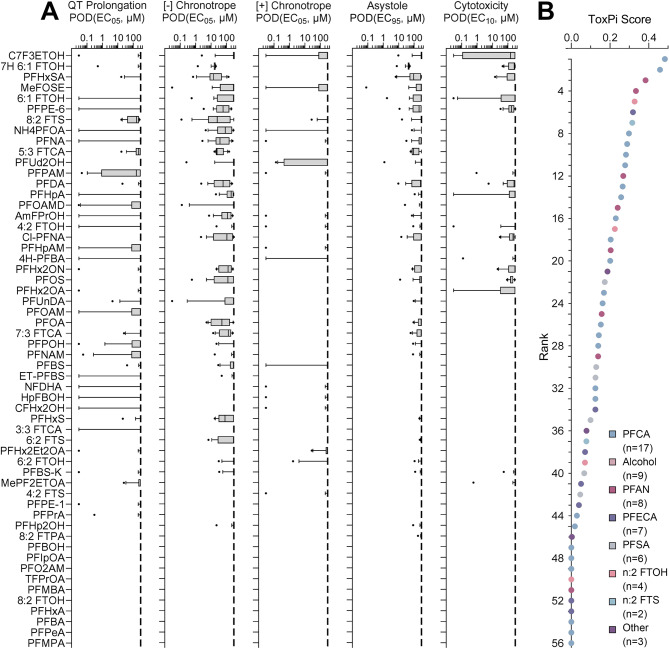
Fig. 3.
PFAS-specific effects on iPSC-derived cardiomyocytes and variability among donors. (A) PODs for five phenotypes are shown and chemicals are sorted by the overall ToxPi score (B). For each phenotype and PFAS, box-and-whisker plots include data from all tested donors. Boxes show the interquartile range, with a line at the median and the whiskers illustrate the 10th to 90th %ile. (B) The PODs for all five phenotypes were integrated (equal weight) into a ToxPi score for each tested PFAS as described in the Methods. A higher score (and rank) indicates higher potency (i.e., lower POD) for cardiotoxicity as evaluated by all five phenotypes combined. Colors of the dots represent the corresponding PFAS subclass as indicated by the legend insert

