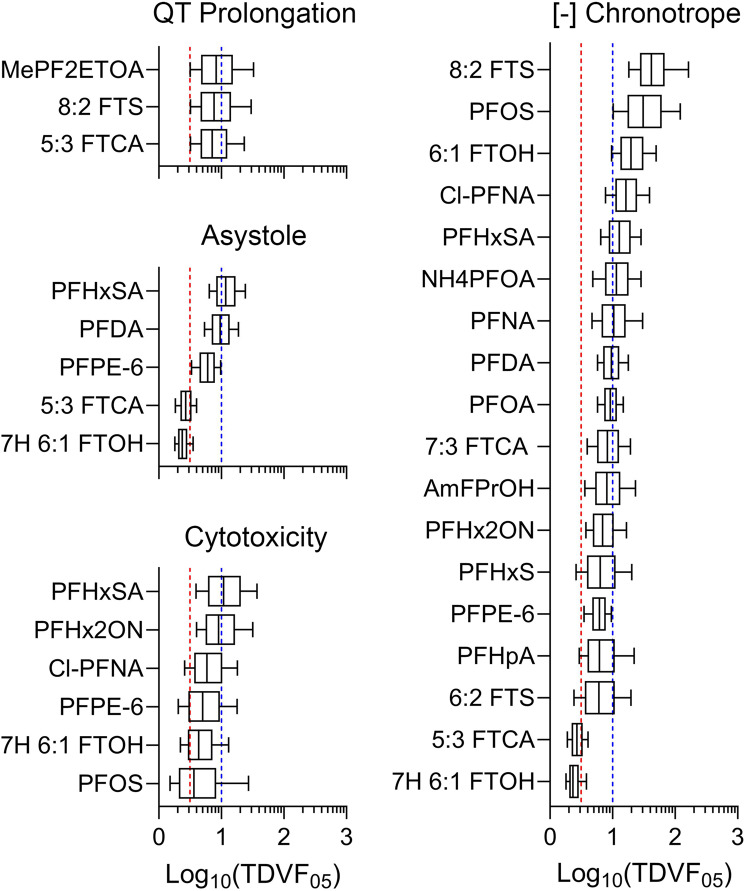
Fig. 5.
Inter-individual variability in PFAS-associated cardiotoxicity phenotypes. TDVF05 values were derived for PFAS that passed variability and activity criteria for each phenotype shown. Box-and-whisker plots show distributions of the TDVF05 values with boxes depicting the interquartile range and whiskers illustrating the 10th to 90th %iles. The vertical red dashed lines represent the default inter-individual toxicodynamic variability factor of 101/2. The vertical blue dashed lines represent the default total inter-individual variability factor of 10. Chemical-specific TDVF05 data can be found in Table S7

