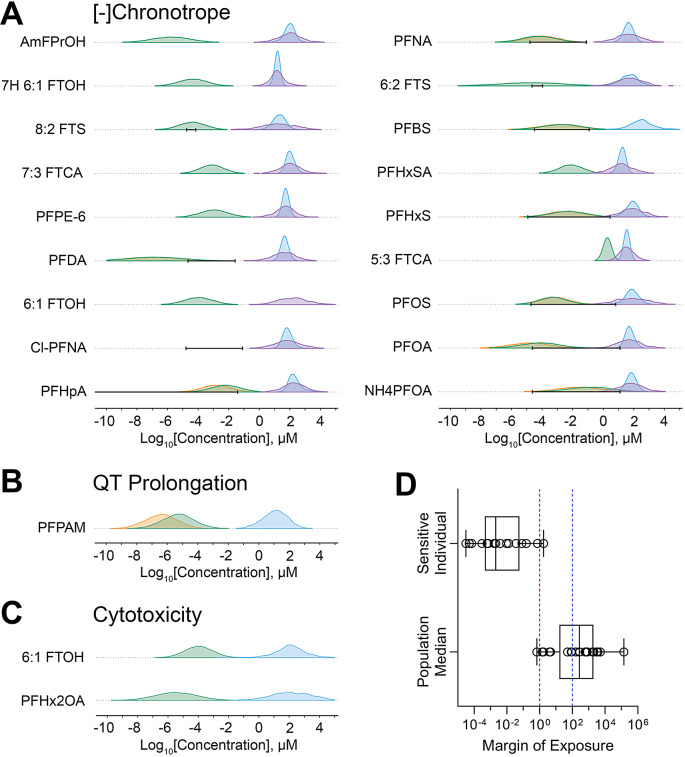
Fig. 6.
Margin of exposure (MOE) estimates for tested PFAS. Chemical-specific MOEs were derived from the most sensitive iPSC-derived cardiomyocyte POD (from all donors and phenotypes) and chemical-specific exposure data (using levels measured in humans and supplementing it with predicted exposure data when needed). (A-C) Density plots illustrating distributions for three phenotypes with at least one PFAS for which an MOE could be derived. Distributions for exposure (green histograms – predicted exposures using plasma protein binding assumptions, orange histograms – predicted exposures using the HTTK assumptions, black bars – the range (5th to 95th %ile) of reported blood levels) and bioactivity (blue histograms –population median PODs, purple – random individual PODs) are shown. (D) The distribution of the MOEs for both the sensitive individual and the population median. The ratio between exposure and bioactivity was calculated as the MOE (on a log scale). Box plots represent the interquartile range and whiskers showing the range from minimum to maximum, and individual dots show values for specific chemicals. The vertical dashed lines are drawn at 1 (no margin of safety) and 100 (the value considered to be “protective” in many human health risk assessments). Chemical-specific MOE estimates can be found in Table S9 and Fig. S3

