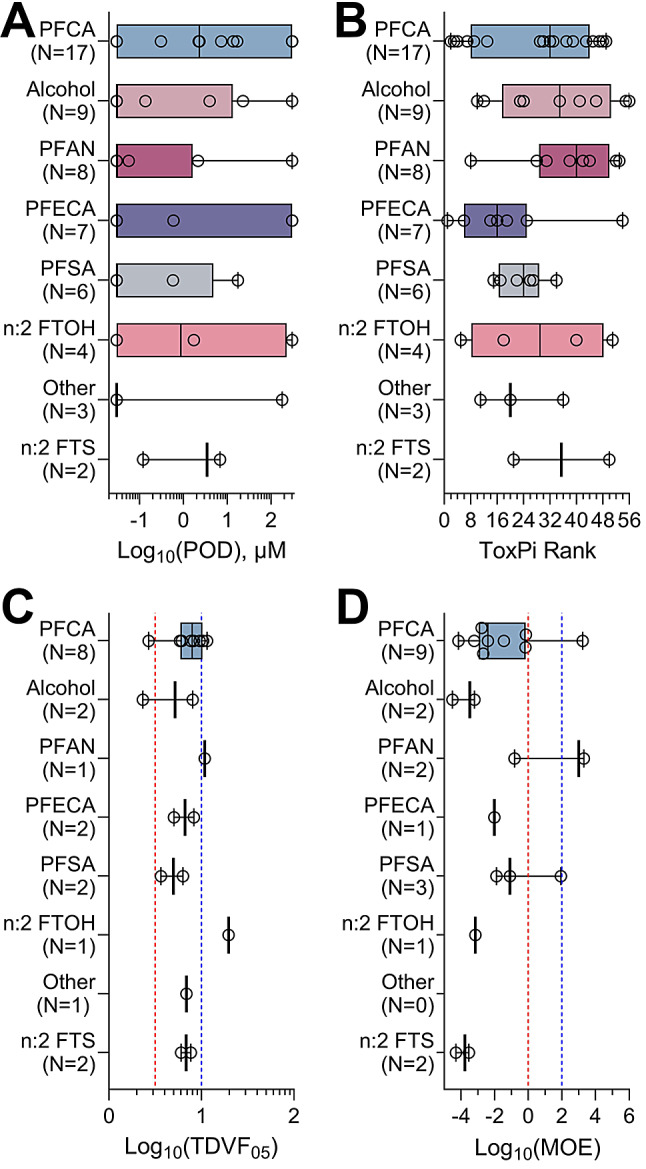
Fig. 7.

PFAS subclass effects on iPSC-derived cardiomyocytes. Data are presented separately for each PFAS subclass (see Table 1). Box plots represent the interquartile range and whiskers showing the range from minimum to maximum, and individual dots show values for specific chemicals. Colors represent the various subclasses and are arranged by subclass with most chemicals to least chemicals. (A) The lowest PODs across all phenotypes for each chemical in a subclass. (B) Overall ToxPi rankings aggregated by subclass. All tested PFAS were included in panels A and B. (C) Toxicodynamic Variability Factors 5th %ile organized by subclass. Only chemicals that were active and passed the criteria for population variability were included. The vertical red dashed line represents the default inter-individual toxicodynamic variability factor of 101/2. The vertical blue dashed line represents the default total inter-individual variability factor of 10. (D) Chemical-specific MOE estimates arranged by subclass. The vertical dashed lines are drawn at 1 (red, no margin of safety) and 100 (blue, the value considered to be “protective” in many human health risk assessments)
