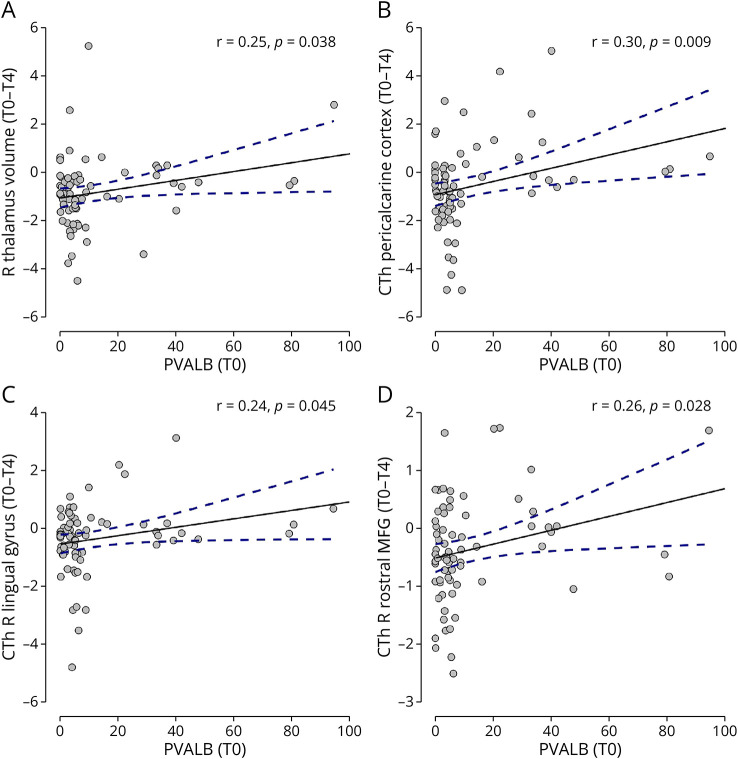
Figure 6. T0 PVALB and MRI Outcomes Changes T0-T4.
Significant association found between levels at MS diagnosis (T0) of PVALB and change in volume of the thalamus (A) and in regional cortical thickness of pericalcarine cortex (B), right lingual gyrus (C), and right rostral middle frontal gyrus (D) over the follow-up period (change T0-T4). PVALB levels are expressed in ng/mL. CTh = cortical thickness; MFG = middle frontal gyrus; R = right.

