
Figure 2.
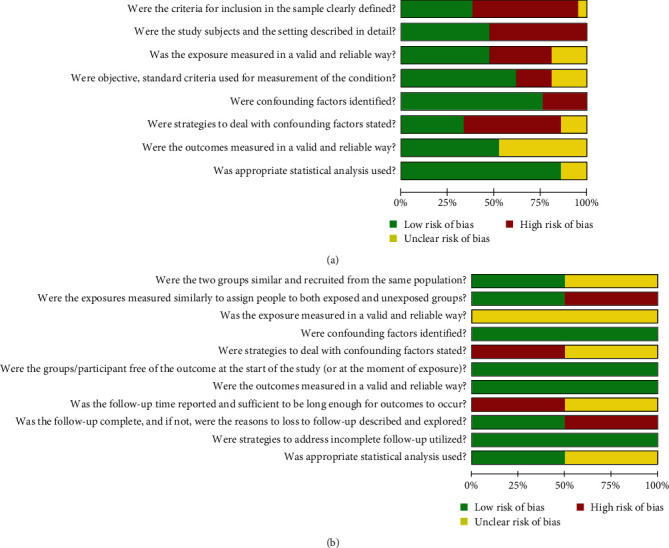
Quality of assessment graph: review authorsʼ judgements presented as percentages across of cross-sectional (a) and cohort studies (b), analyzed according to the Joanna Brigs Institute (JBI) checklist.
Official websites use .gov
A
.gov website belongs to an official
government organization in the United States.
Secure .gov websites use HTTPS
A lock (
) or https:// means you've safely
connected to the .gov website. Share sensitive
information only on official, secure websites.
Quality of assessment graph: review authorsʼ judgements presented as percentages across of cross-sectional (a) and cohort studies (b), analyzed according to the Joanna Brigs Institute (JBI) checklist.