
Figure 3.
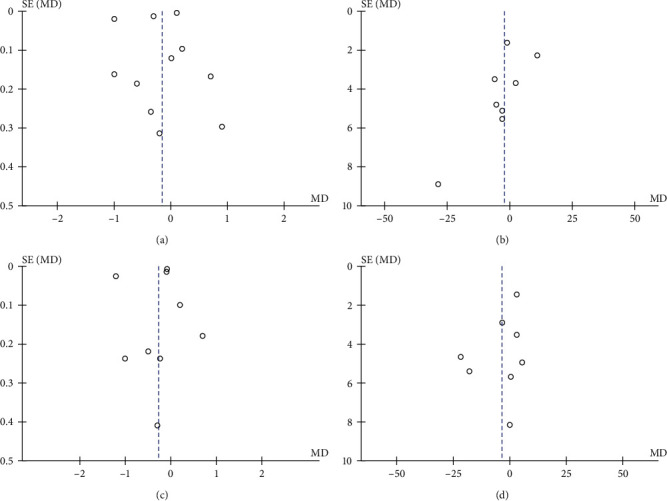
Heterogeneity of studies included in the quantitative analysis. Funnel plot for probing pocket depth (a), bleeding on probing (b), clinical attachment level (c), and plaque index (d).
Official websites use .gov
A
.gov website belongs to an official
government organization in the United States.
Secure .gov websites use HTTPS
A lock (
) or https:// means you've safely
connected to the .gov website. Share sensitive
information only on official, secure websites.
Heterogeneity of studies included in the quantitative analysis. Funnel plot for probing pocket depth (a), bleeding on probing (b), clinical attachment level (c), and plaque index (d).