Figure 3.

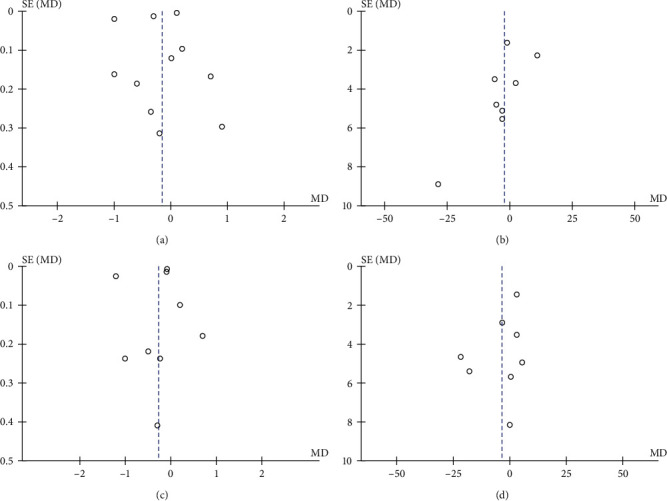
Heterogeneity of studies included in the quantitative analysis. Funnel plot for probing pocket depth (a), bleeding on probing (b), clinical attachment level (c), and plaque index (d).

Heterogeneity of studies included in the quantitative analysis. Funnel plot for probing pocket depth (a), bleeding on probing (b), clinical attachment level (c), and plaque index (d).