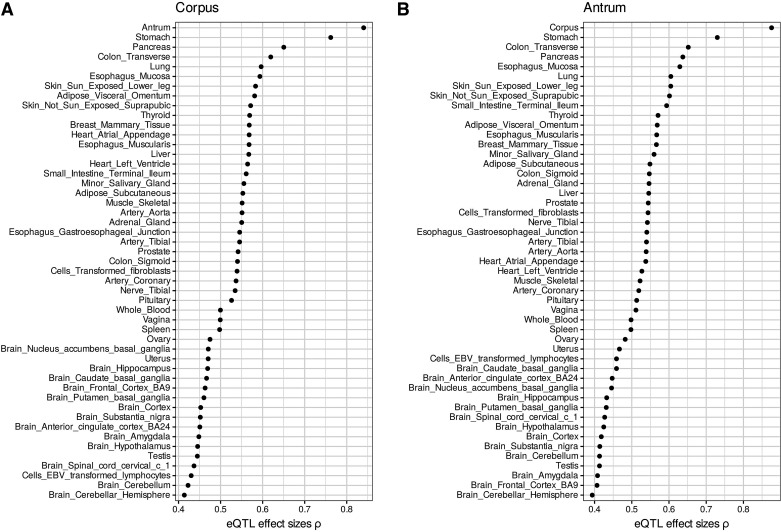
Figure 1.
Meta-analysis with the GTEx v7 eQTL data set. Pairwise spearman correlation of eQTL effect sizes between corpus (A) or antrum (B) and GTEx v7 tissues. We only considered significant variant-gene associations based on permutations and FDR ≤ 0.05. eQTL, expression quantitative trait locus; GTEx, Genotype-Tissue Expression.

