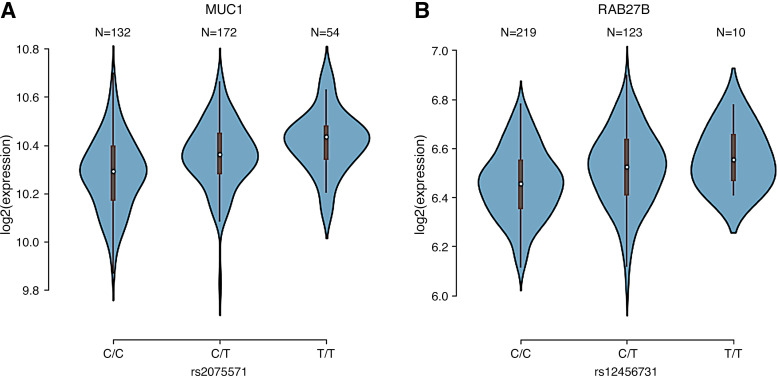
Figure 5.
Exemplary eQTL in corpus. Violin plots of associations between genotypes of rs2075571 and MUC1 expression (A) and genotypes of rs12456731 and RAB27B expression (B). C and T alleles indicate the reference and alternative allele types. The plots indicate the density distribution of the samples in each genotype. The white dot in the box plot (black) shows the median value of the gene expression at each genotype. Number of subjects for each genotype shown above violin. eQTL, expression quantitative trait locus.

