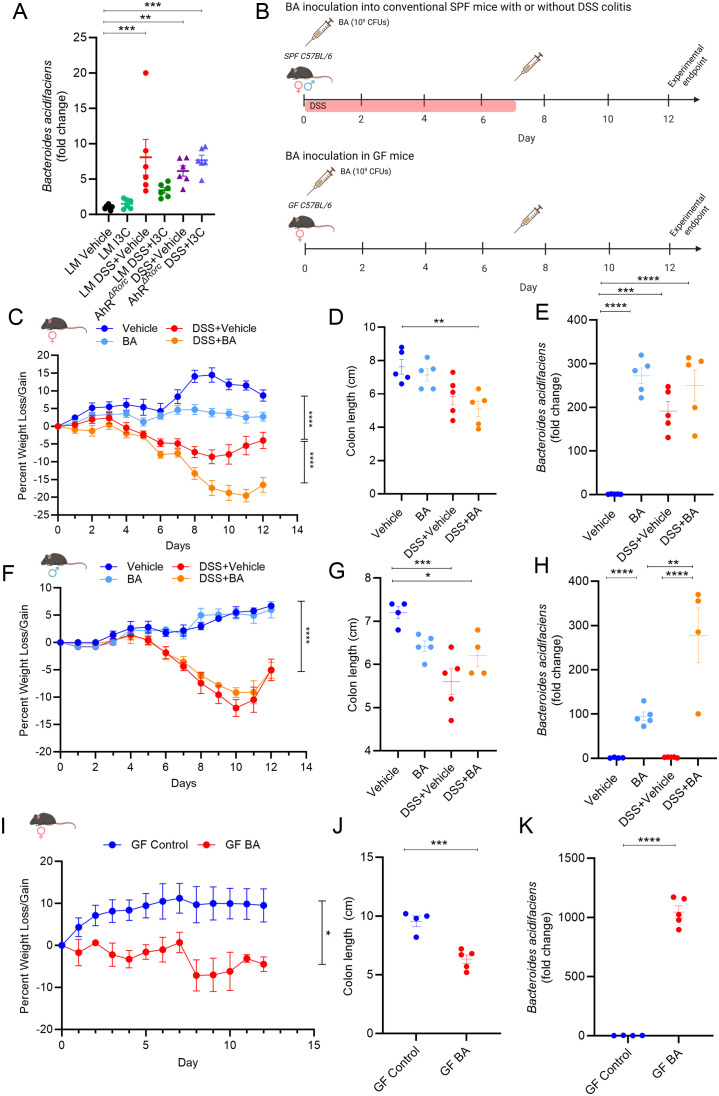
Figure 6.
B. acidifaciens affects colitis in female, but not male mice. (A) Dot plot depicting PCR results evaluating B. acidifaciens from colonic content collected from female mice in the following experimental groups: LM Vehicle (n=6), LM I3C (n=6), LM DSS+Vehicle (n=6), LM DSS+I3C (n=6), AhRΔRorc DSS+Vehicle (n=6), and AhRΔRorc DSS+I3C (n=6). (B) Illustration depicting experimental design inoculating B. acidifaciens (BA) into SPF (top) and GF (bottom) experimental cohorts. Created with Biorender. (C–E) Results from BA inoculation studies in SPF female mice with DSS-induced colitis in the following groups: Vehicle (n=5), BA (n=5), DSS+Vehicle (n=5), DSS+BA (n=5). (C) Graph depicting weight loss/gain over time. (D) Dot plot depicting colon length. (E) Dot plot depicting fold change of B. acidifaciens compared to Vehicle control as assessed by PCR. (F-H) Results from BA inoculation studies in SPF male mice with DSS-induced colitis in the following groups: Vehicle (n=4), BA (n=5), DSS+Vehicle (n=5), DSS+BA (n=4). (F) Graph depicting weight loss/gain over time. (G) Dot plot depicting colon length. (H) Dot plot depicting fold change of B. acidifaciens compared to Vehicle control as assessed by PCR. (I–K) Results from BA inoculation studies in GF female mice in the following groups: GF control (n=4), GF BA (n=5). (I) Graph depicting weight loss/gain over time. (J) Dot plot depicting colon length. (K) Dot plot depicting fold change of B. acidifaciens compared to Vehicle control as assessed by PCR. Error bars equal the standard error mean (SEM). For dot plots, significance was determined using one-way ANOVA and Tukey’s multiple comparisons test. For weight data over time, two-way ANOVA and Dunnett’s multiple comparisons test was used to determine significant (*p<0.05, **p<0.01,***p<0.005, ****p<0.001).

