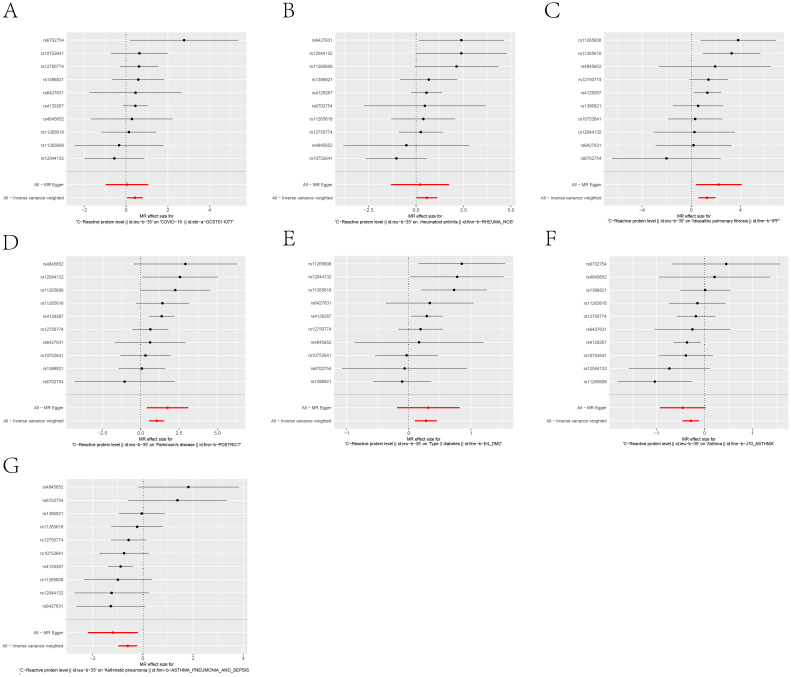
Figure 5.
Forest plot of each SNP’s causal relationship with seven diseases, including: (A) COVID-19, (B) Rheumatoid arthritis, (C) Idiopathic pulmonary fibrosis, (D) Parkinson’s disease, (E) Type 2 diabetes, (F) Asthma, (G) Asthmatic pneumonia.The black dots represent the mean values,All-MR Egger and All-Inverse variance weighted represent the overall effect of all instrumental variables.

