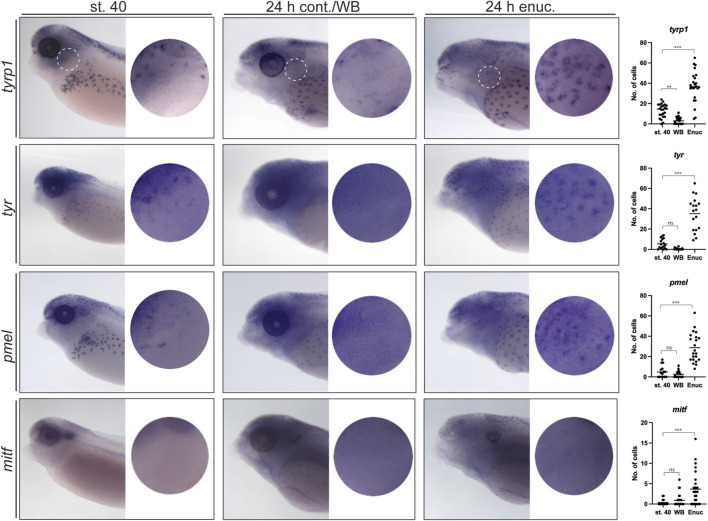
FIGURE 3.
Enucleation triggers substantial changes in the expression of tyrp1, tyr and pmel but not mitf in perioptic melanophores. At stage 40, tyrp1, tyr, and pmel are expressed by a small number of perioptic melanophores as assessed by WMISH, whereas mitf expression is rarely visible in individual cells by this method (circular insets show perioptic region; st40 tyrp1 = 13.04 ± 1.36, n st40 tyrp1 = 24, N = 3; st40 tyr = 5.41 ± 1.20, n st40 tyr = 17, N = 2; st40 pmel = 4.81 ± 1.44, n st40 pmel = 16, N = 2; st40 mitf = 0.38 ± 0.18, n st40 mitf = 16; N = 2). After 24 h on a white background with illumination from above (24 h cont./WB), the number of cells expressing tyrp, tyr, and pmel appears reduced, while there continues to be very few mitf expressing cells in the perioptic region ( WB tyrp1 = 2.96 ± 0.61, n st40 tyrp1 = 27; WB tyr = 0.50 ± 0.20, n WB tyr = 18; WB pmel = 2.50 ± 0.67, n WB pmel = 22; WB mitf = 0.89 ± 0.28, n WB mitf = 28). In contrast, WMISH reveals a dramatic increase in tyrp1, tyr, and pmel expressing cells in larvae enucleated at stage 40, prior to being maintained for 24 h in the light on a white background ( Enuc tyrp1 = 36.75 ± 3.12, n Enuc tyrp1 = 24; Enuc tyr = 35.17 ± 3.90, n Enuc tyr = 18; Enuc pmel = 28.82 ± 3.06, n Enuc pmel = 22). However, enucleation does not result in a dramatic increase in mitf-labeled cells in the perioptic region ( Enuc mitf = 3.67 ± 0.78, n Enuc mitf = 27). (One-way ANOVA results: tyrp1:F 2,72 = 81.34, p < 0.0001; tyr:F 2,50 = 62.23, p < 0.0001; pmel:F 2,57 = 50.88, p < 0.0001; mitf:F 2,68 = 10.20, p < 0.0001). **p < 0.001, ***p < 0.0001, n. s., not significant, Tukey’s test.

