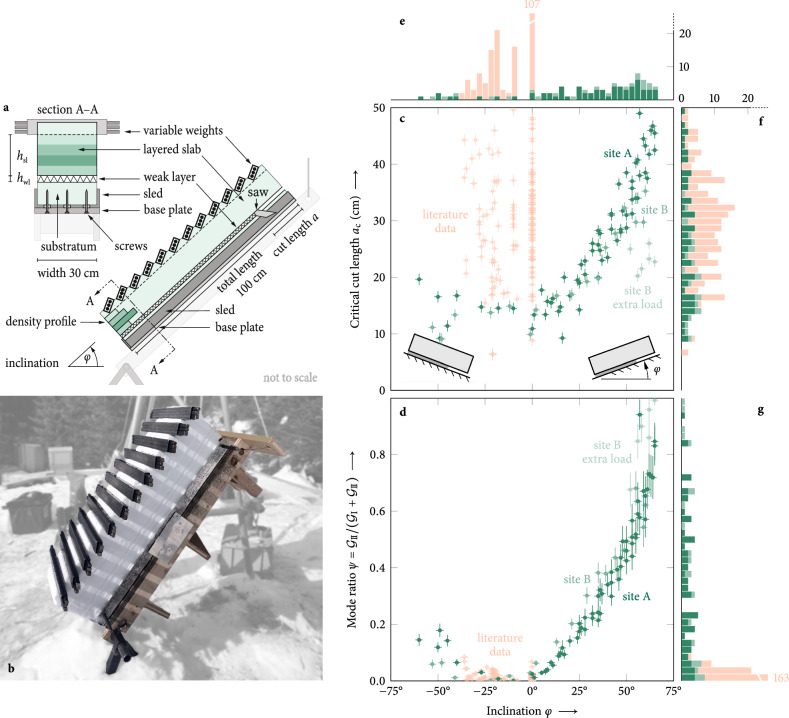
Fig. 1. Mixed-mode fracture tests.
a Illustration of the experimental setup. b Extracted slab–weak-layer assembly with added weights at 60° prior to cutting the weak layer. c Critical cut lengths values, the measured length at which the artificially introduced crack becomes unstable, for the present study (green, ∣S∣ = 88, where S is the set of experimental samples) and from the literature44 (orange, ∣S∣ = 183). The literature dataset contains only upslope cuts (φ ≤ 0°) but several different weak layers and slab assemblies such that recorded cut lengths scatter widely. Tests on the same slab–weak-layer assembly with constant added weights (site A), 1.59 kN/m2, show a trend of increasing critical cut lengths ac with inclination for downslope cuts (φ > 0°). Increasing surface dead loads (site B) with extra load, 2.53 kN/m2, vs. site B, 1.48 kN/m2, breaks the observed trend. Critical cut lengths were measured with ±1 cm uncertainty and slope angles with ±2° uncertainty. d Mode II energy release rate at the onset of unstable crack propagation as a fraction of the total energy release rate. The mode II fraction increases rapidly with inclination for downslope cuts (φ > 0°) but only moderately for upslope cuts (φ < 0°). All data points (site A, site B, site B with extra load, literature data) follow the same trend with little scatter. The literature dataset comprises almost no mode II contribution, even at inclinations as high as 36°. Mode-ratio uncertainties were calculated from error propagation of uncertainties in cut length (±1 cm), inclination (±2°), and weak-layer thickness (±1 mm). e–g Stacked histograms truncated at 20 counts per bin. The distribution of tested inclinations (e) shows that, historically, propagation saw tests were predominantly performed in flat terrain and cut upslope (orange) while the present study (green) focuses on steep downslope cuts. Critical cut lengths (f) are distributed uniformly with mean and standard deviation of ac = 31.0 ± 14.4 cm indicating equal likelihood for a wide range of cut lengths. The distribution of mode II fractions of the total energy release rate (g) shows that the literature data (orange) contains no information on mode II energy release rates while the present study (green) covers the full range between pure mode I and pure mode II fracture toughness of weak layers.

