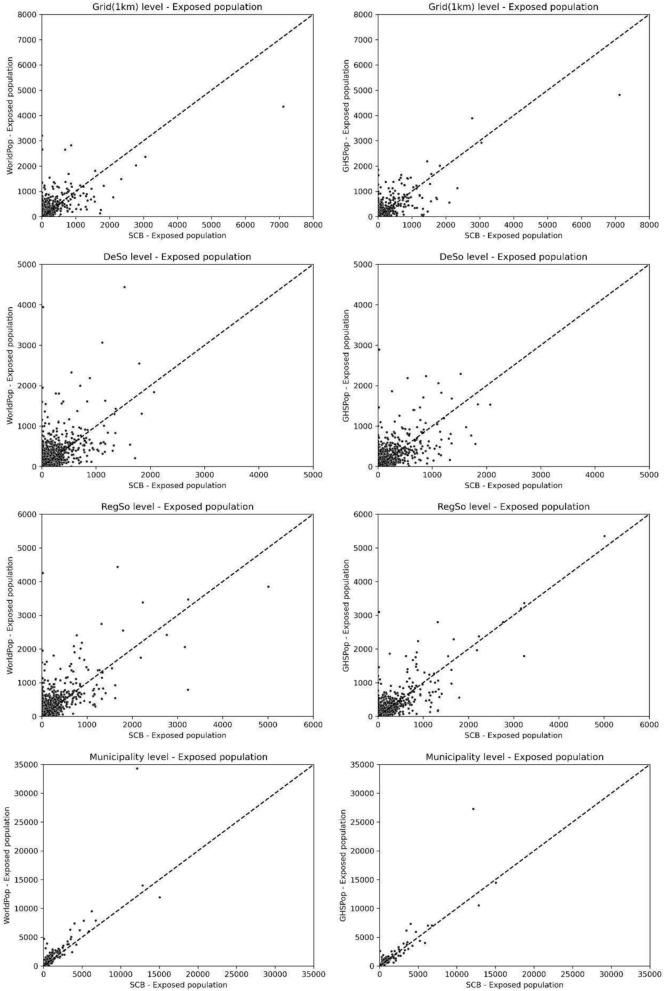
Fig. 1.
Scatter plots comparing the exposed population estimates from the reference dataset (SCB—Swedish Statistical Bureau) to those from the generated datasets, WorldPop (left column) and GHSPop (right column), across four administrative levels : Grid (1 km), Demographic Statistical Areas (DeSo), Regional Statistical Areas (RegSo), and Municipality. Each plot shows the SCB estimates on the x-axis and the corresponding estimates from WorldPop and GHSPop on the y-axes. The dashed line represents the 1:1 ratio, indicating perfect agreement between the datasets. The dispersion of points around this line illustrates the degree of correlation and potential discrepancies in population exposure estimates between the different sources and administrative divisions.

