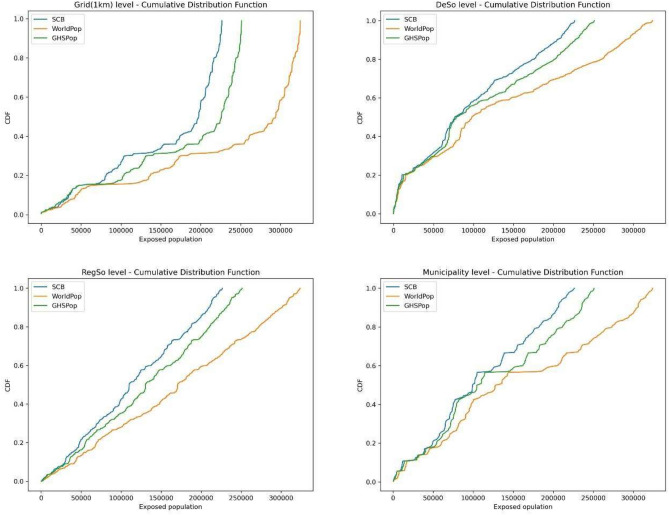
Fig. 2.
Cumulative Distribution Functions (CDFs) comparing the exposed population estimates from the reference dataset (SCB—Swedish Statistical Bureau) to those from the generated datasets, WorldPop and GHSPop , across four administrative levels : Grid (1 km) (n = 534712), Demographic Statistical Areas (DeSo) (n = 5985), Regional Statistical Areas (RegSo) (n = 3363), and Municipality (n = 290). Each plot shows the CDF of exposed population estimates, with SCB in blue, WorldPop in red and GHSPop in green. The x-axis represents the exposed population, while the y-axis represents the cumulative probability.

