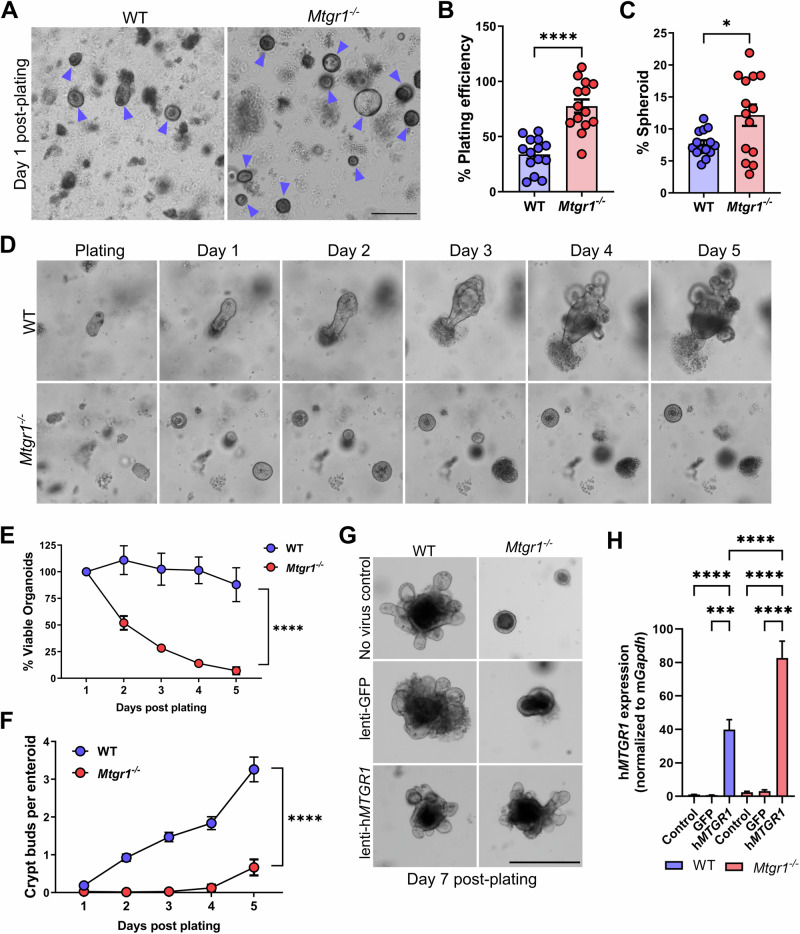
Fig. 3. MTGR1 loss increases initial plating efficiency but is not compatible with enteroid survival.
A Crypts were isolated from WT and Mtgr1−/− mice and plated as intestinal enteroids. Representative images of enteroids at day 1 post-plating with enteroids marked by blue arrows. Scale bar = 200 µm (left), (A–E) representative of 4 independent experiments. B Quantification of overall plating efficiency (enteroids established divided by crypts plated) and (C) percentage of enteroids with cystic morphology calculated per well at day 1 post-plating. n = 14 wells per genotype. D 5-day timelapse imaging of WT and Mtgr1−/− enteroids. E Average enteroid viability post-plating, shown as the percent viable enteroids remaining from day 1. n = averaged 4 independent experiments per genotype. F Quantification of crypt budding post-plating. n = 75, 67, 74, 68, and 26 WT enteroids and n = 136, 121, 70, 16, and 6 Mtgr1−/− enteroids. G WT and Mtgr1−/− crypts were transduced with lentiviral GFP or human MTGR1 and plated to allow enteroid formation. Representative images at day 7 post-infection/plating. Scale bars = 500 µm. H Transduced enteroids were collected at day 7 post-infection for mRNA analysis of human MTGR1. Results were normalized to Gapdh and shown as fold change over WT non-transduced controls. n = 2–3 independent experiments for addback studies. *P < 0.05, **P < 0.01, ***P < 0.001, ****P < 0.0001, Student’s t test (B, C), two-way ANOVA (E, F), or one-way ANOVA (H).

