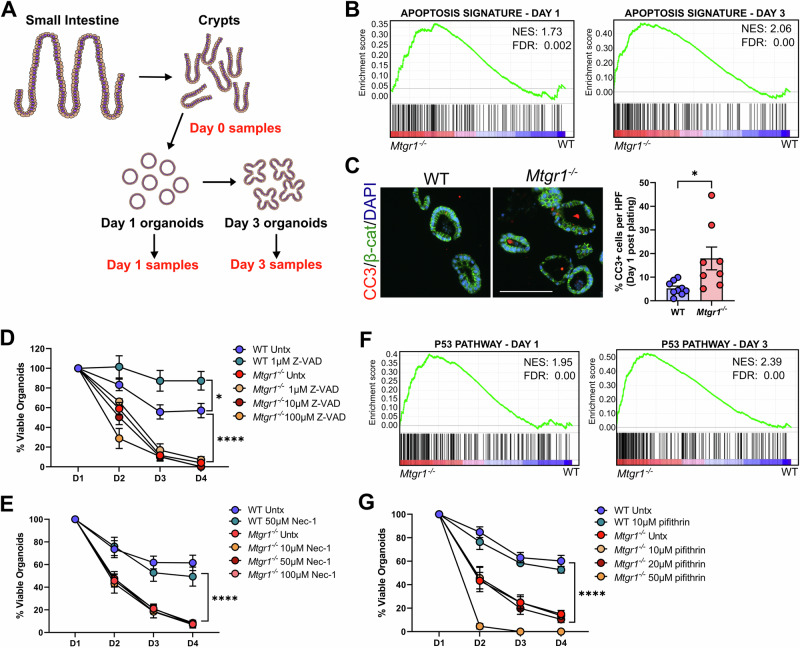
Fig. 4. MTGR1-dependent enteroid loss cannot be rescued by inhibition of cell death pathways.
A Schematic of RNA-sequencing experiment of crypts and enteroids. n = 3 mice per genotype per timepoint. B GSEA of “Hallmark” collection apoptosis-related genes in Mtgr1−/− enteroids at day 1 (left) and day 3 (right) post-plating. NES = normalized enrichment score. C Enteroids were fixed and embedded at day 1 post-plating, and apoptotic cells were marked by immunofluorescent staining against cleaved caspase-3 (CC3, red). β-catenin (green) and DAPI (blue) were used for co-staining. Quantification shown as percent CC3-positive cells per high powered field (HPF). Scale bar = 200 µm. n = 9 WT and 8 Mtgr1−/− HPFs. D Enteroids were plated and overlaid with media containing indicated concentrations of the caspase inhibitor, Z-VAD-FMK, or (E) the necrosis inhibitor, necrostatin. Enteroids were counted daily and normalized to day 1 numbers. n = 6 wells per condition. F GSEA of “Hallmark” collection p53 pathway-related genes in Mtgr1−/− enteroids at day 1 (left) and day 3 (right) post-plating. G Enteroids were plated and overlaid with media containing the p53 inhibitor, pifithrin, as indicated. n = 6 WT and 12 untreated, 9 (10 µm), 10 (20 µm), and 3 (50 µm) Mtgr1−/− enteroid wells. *P < 0.05, ****P < 0.0001, Student’s t test (C) or two-way ANOVA (D, E, G), significance indicated by FDR q value (B, F).

