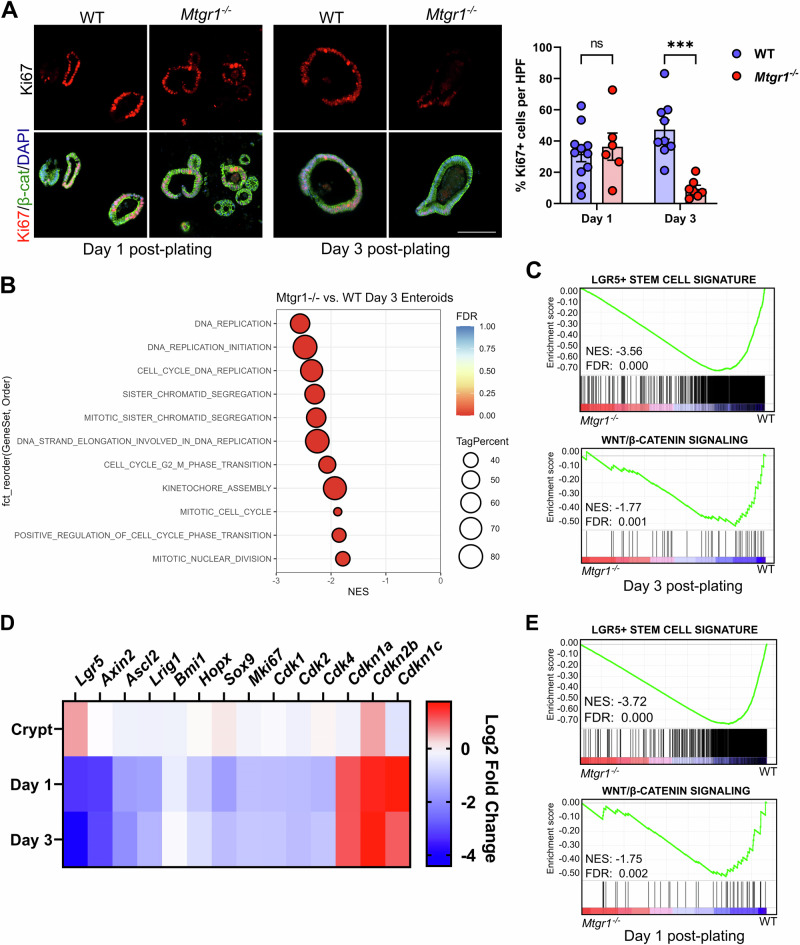
Fig. 5. MTGR1 loss decreases proliferation and stem cell-associated gene expression during enteroid maturation.
A WT and Mtgr1−/− enteroids were fixed at day 1 and day 3 post-plating and proliferative cells were marked via immunohistochemistry for Ki67 (red). β-catenin (green) and DAPI (blue) were used for co-staining. Quantification shown as percent Ki67-positive cells per high powered field (HPF). Scale bar = 200 µm. n = 11 or 9 WT and 6 or 7 Mtgr1−/− HFPs per timepoint. B Gene set enrichment analysis (GSEA) of day 3 RNA-sequencing results using cell cycle-related gene sets queried from the Gene Ontology collection. NES = normalized enrichment score. Tag % = the percentage of gene hits before (for positive ES) or after (for negative ES) the peak in the running ES, indicating the percentage of genes contributing to the ES. C GSEA of day 3 RNA-sequencing results with intestinal stem cell- (top) and Wnt-associated (bottom) gene sets. D Heatmap of RNA-sequencing results of stem cell, cyclin dependent kinases, and cyclin-dependent kinase inhibitors from crypt, day 1, and day 3 results. Represented as the Log2 fold change of Mtgr1−/− results as compared to WT at that timepoint. E GSEA of day 1 RNA-sequencing results with intestinal stem cell- (top) and Wnt-associated (bottom) gene sets. ns = nonsignificant, ***P < 0.001, Student’s t test (A), significance indicated by FDR q value (B, C, E).

