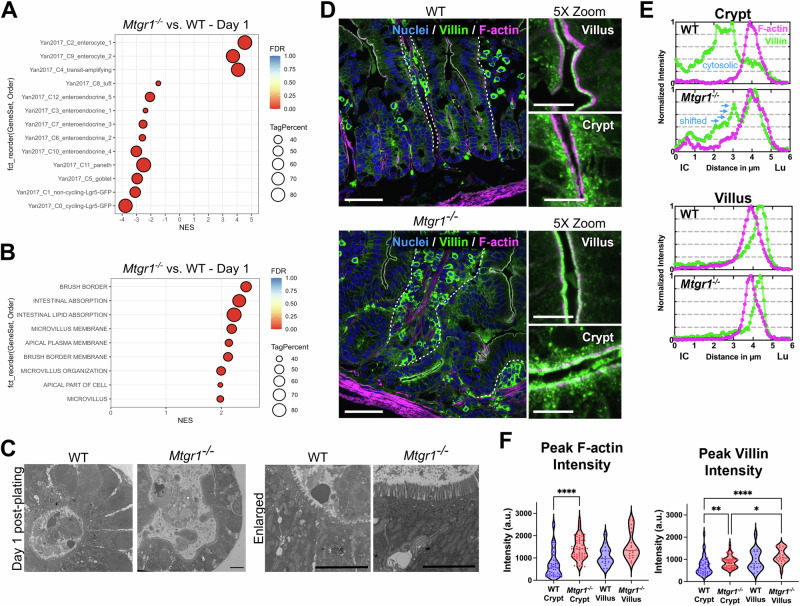
Fig. 6. MTGR1 loss promotes absorptive differentiation.
A Gene set enrichment analysis (GSEA) of Mtgr1−/− day 1 enteroid RNA-sequencing results using gene sets representing intestinal epithelial cell types. NES = normalized enrichment score. Tag % = the percentage of gene hits before (for positive ES) or after (for negative ES) the peak in the running ES, indicating the percentage of genes contributing to the ES. Significance indicated by FDR q value. B GSEA of day 1 Mtgr1−/− RNA-sequencing results using gene sets representing microvilli and brush border biology queried from the Gene Ontology collection at day 1 post plating. C Representative electron microscopy images from WT and Mtgr1−/− day 1 enteroid samples, n = 2 per genotype. Scale bar = 5 µm. D Representative confocal images from WT and Mtgr1−/− mouse duodenal tissue stained with DRAQ5 (blue, nuclei), Villin (green), and phalloidin (F-actin, magenta). Dotted lines designate basal epithelial border on villi. Enlarged images (5x zoom) highlight crypt and villus surfaces. Main panel scale bars 50 µm, 5× zoom scale bars 10 µm. E Representative normalized line scans showing F-actin (magenta) and Villin (green) intensities. Line scans are oriented from intracellular (IC, distance = 0) to the intestinal lumen (Lu). F Quantification of peak F-actin intensity (left) and peak Villin intensity (right) on crypt and villus epithelial surfaces. Data represents peak background subtracted intensity from a minimum of 15 line-scans obtained from at least 5 separate crypts/villi and tissue from 3 separate mice. *P < 0.05, **P < 0.01, ****P < 0.0001. Significance indicated by FDR q value (A, B) or Kruskal–Wallis test (F).

