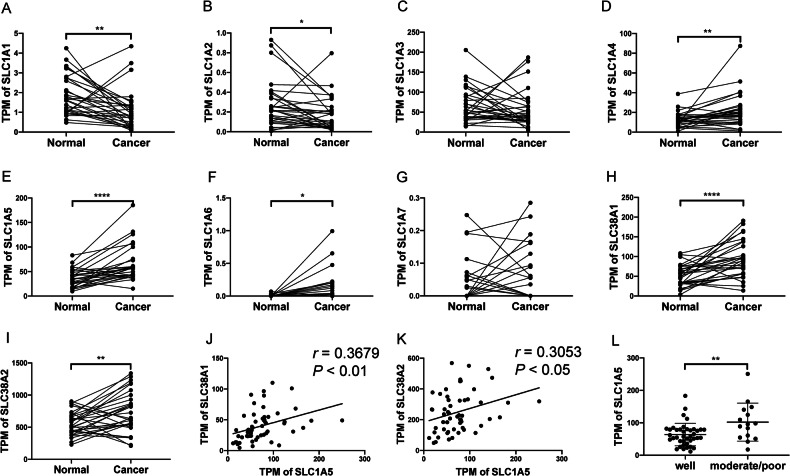
Fig. 1. Analysis of OSCC RNA sequencing data.
A–I The TPM of the SLC1A family, SLC38A1, and SLC38A2 in 30 paired adjacent normal tissues and OSCC tumor tissue. J, K The correlation between SLC1A5 and SLC38A1 or SLC38A2, respectively. L The correlation between SLC1A5 and tumor differentiation (well-differentiated, n = 40; moderately/poorly-differentiated, n = 15). Paired t-test, Mann-Whitney test, or correlation analysis. r, correlation coefficient. *, **, and ****, P < 0.05, P < 0.01, and P < 0.0001, respectively.

