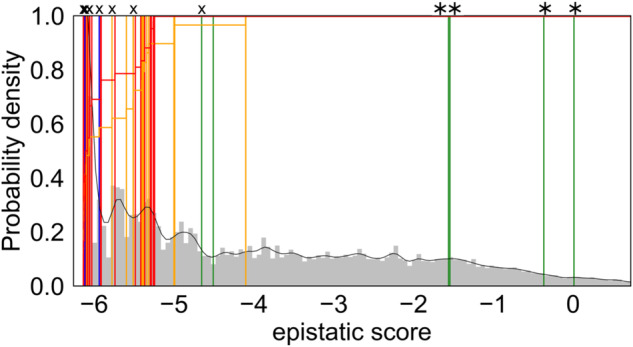
Fig. 2. Histograms of the epistatic prediction scores (model 3) of 80 previously published CACNA1D variants with updated pathogenicity classifications (Table 1).

The histogram displays the performances of the epistatic model on 80 CACNA1D variants reported somatically in adrenal lesions (APAs/APCCs associated with hyperaldosteronism) or germline in individuals with a neurodevelopmental disorder [11, 12]. Variants were classified into pathogenic (red), likely pathogenic (orange), of uncertain significance (blue) and likely benign (green). These variants are mapped into histograms of the scores of all possible variants calculated for the Cav1.3 α1-subunit sequence as described in “Methods” (aa 68-1888; shown in gray). The overall ratio of pathogenic (red) and likely pathogenic variants (orange) predicted up to a certain score is shown in the histogram (horizontal lines). Four reclassified mutations are indicated with “*” on the top and those re-assessed in terms of the potential risk with “X” (SI Table 3).
