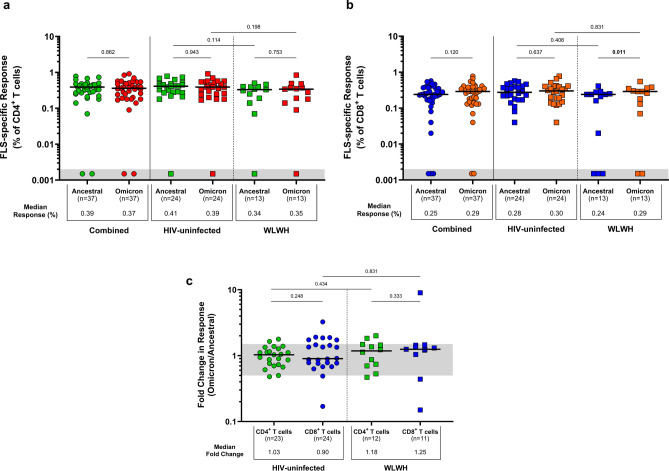
Fig. 5.
T-cell responses to the spike protein of WT SARS-CoV-2 and the Omicron variant in women living with and without HIV. The proportion of spike-specific T cells producing IL-2, IFN-γ, or TNF-α in response to peptide pools representing partial ancestral and Omicron spike proteins. SARS-CoV-2 specific (a) CD4+ T-cell responses and (b) CD8+ T-cell responses. Each participant is represented by an individual point, and medians in each group are indicated by horizontal lines. (c) The fold change in spike-specific CD4+ and CD8+ T-cell responses. Ratios equal to 1.0 indicate equal responses to WT SARS-CoV-2 and Omicron. Ratios below 1.0 indicate greater responses to WT SARS-CoV-2 compared to Omicron. Ratios above 1.0 indicate greater responses to Omicron compared to WT SARS-CoV-2. The threshold area between 0.5 and 1.0 is indicated in grey, representing similar responses to WT SARS-CoV-2 and Omicron. Statistical analyses were performed using the Mann–Whitney U-test and Wilcoxon signed-rank test for comparisons between unpaired (HIV-uninfected vs. WLWH) and paired (HIV-uninfected and WLWH: ancestral vs. Omicron) T-cell responses and fold changes, respectively. Significant p-values are indicated in bold (p < 0.05). Denotations: FLS full-length spike glycoprotein, HIV- HIV-uninfected women, WLWH women living with HIV, WT wild-type (ancestral) SARS-CoV-2.

