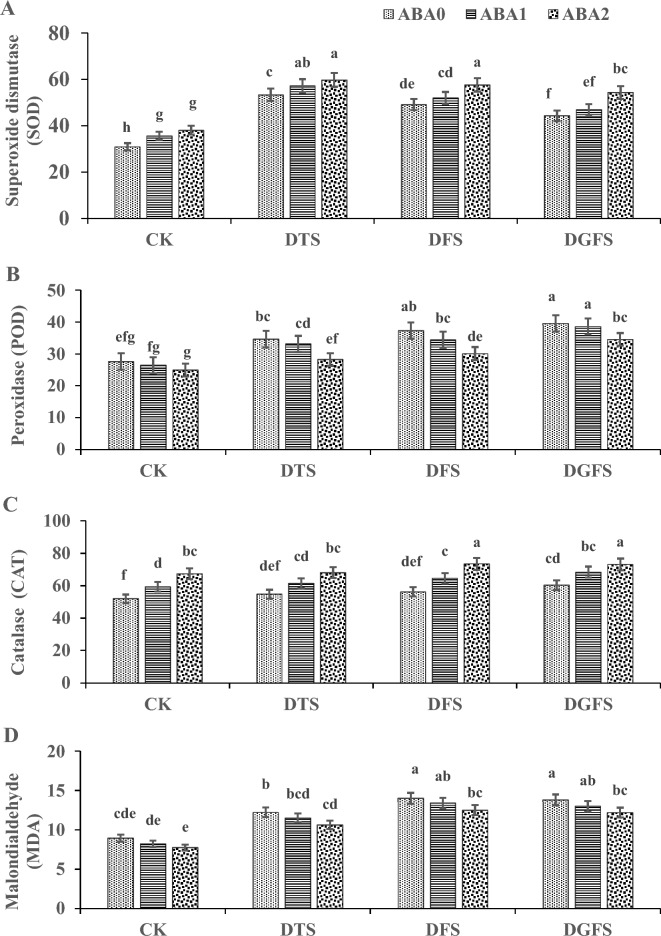
Fig. 4.
Illustrates the impact of ABA application on Superoxide dismutase (μmol min−1 mg−1 protein), Peroxidase (μmol min−1 mg−1 protein), Catalase (μmol min−1 mg−1 protein) and Malondialdehyde (μmol min−1 mg−1 protein) activities under drought stress at critical growth stages of wheat. The labels CK, DTS, DFS, and DGFS represent the control as no drought at any stage, drought at tillering, flowering, and grain-filling stages, respectively. ABA0, ABA1 and ABA2 indicates control, 100 mgL−1 and 200 mgL−1 ABA application respectively. The error bars in the figure indicate the standard error (n = 3).

