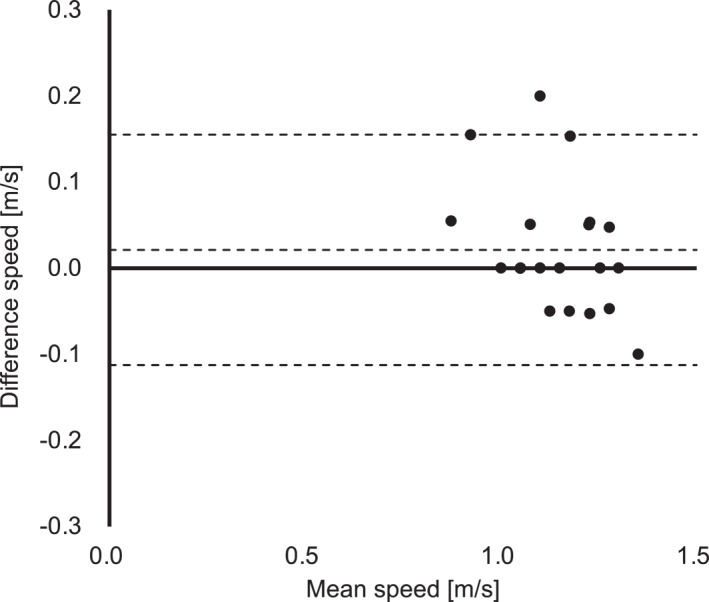
FIGURE 7.

Bland–Altman plot of the speed at sweat lactate threshold in incremental exercise test without breaks (test 2) and blood lactate threshold in incremental exercise test with breaks (test 1). This graph shows no systematic error in the speed at sweat lactate threshold in incremental exercise test without breaks (test 2) and blood lactate threshold in incremental exercise test with breaks (test 1).
