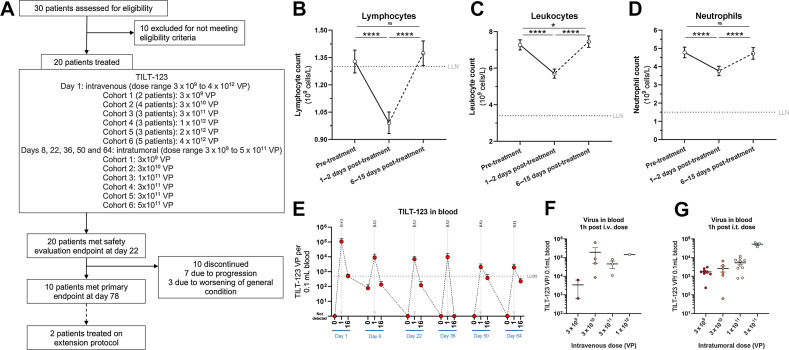
Figure 1.
A, Trial outline. B, Lymphocyte changes after TILT-123, all cohorts pooled. C, Leukocyte changes after TILT-123, all cohorts pooled. D, Neutrophil changes after TILT-123, all cohorts pooled. E, Virus detection in blood by qPCR, before treatment, 1 hour post-treatment and 16 hours post-treatment, all dose cohorts available pooled (N = 10 patients). F, Virus detection in blood by qPCR 1 hour after intravenous dose, stratified by intravenous dose given. G, Virus detection in blood by qPCR 1 hour after intratumoral dose, stratified by intratumoral dose given. For all graphs, mean ± SEM shown. For B–D, P value from two-sided t test shown for graphs. LLOQ, lower limit of quantification; ns, non-significant (P > 0.05); *, P < 0.05; ****, P < 0.001.

