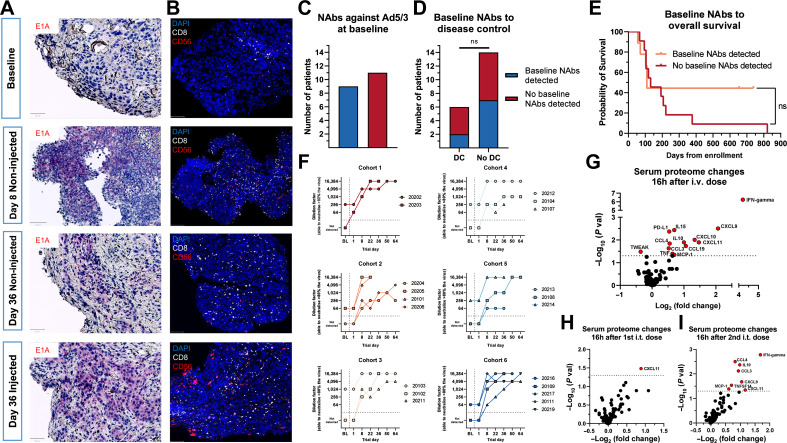
Figure 4.
A, Virus staining (violet) in tumor biopsies from patient 20202 at different time points across the trial, showing productive virus replication in injected and noninjected lesions; scale bar, 50 mm. B, Tumor IHC from patient 20202 staining for DAPI, CD8, and CD56 showing increased numbers of effector lymphocytes in injected and non-injected lesions post-treatment; scale bar, 100 μm. C, Neutralizing antibodies (NAbs) against TILT-123 at baseline in all patients. D, Neutralizing antibody presence compared with disease control at day 78. Disease control defined as SMD or better at day 78. No disease control defined as PMD or NA at day 78. Groups compared with the Fisher’s exact test. E, Baseline neutralizing antibody presence compared with overall survival across trial. Groups compared with the MaxCombo log-rank test. F, Neutralizing antibody titer across trial in all dose cohorts. Baseline defined as day 1 pre-treatment value, for days 1 to 64 the highest titer shown for each day (pre-or post-treatment). G, Serum proteomic changes 16 hours after intravenous dosing of TILT-123, pooled patients from cohorts 1 to 5 (n = 15). H, Serum proteomic changes 16 hours after first dose of intratumoral dosing of TILT-123, pooled patients from cohorts 1 to 5 (n = 15). I, Serum proteomic changes 16 hours after second dose of intratumoral dosing of TILT-123, pooled patients from cohorts 1 to 5 (n = 15). For G–I, difference between pre‐and post-treatment protein calculated with the Mann–Whitney U test; ns, non-significant (P > 0.05).

