Fig. 1.
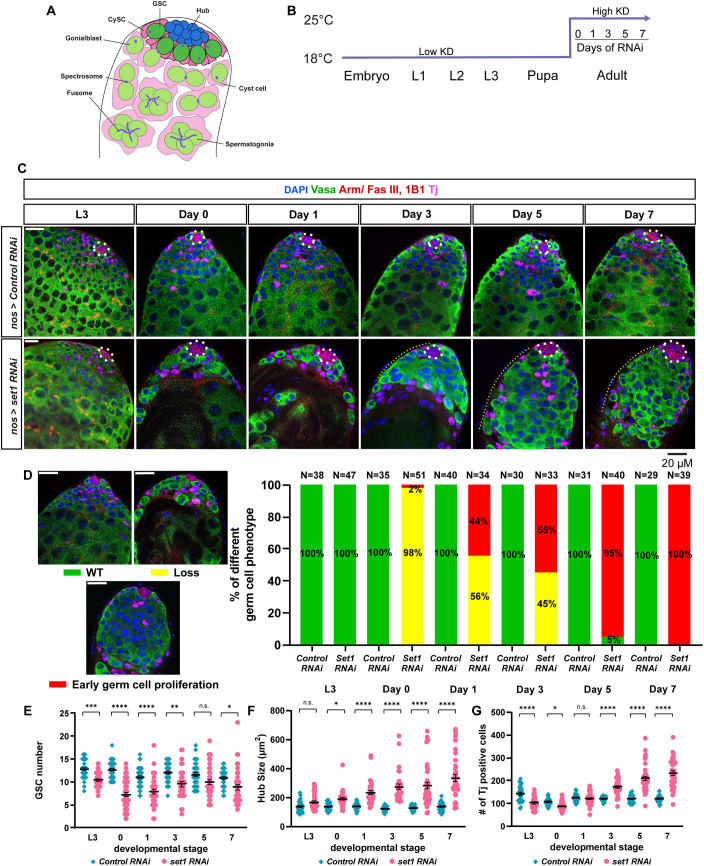
Drosophila Set1 is required cell-autonomously for germline maintenance and differentiation. (A) Schematic of the tip of the Drosophila testis. CySC, cyst stem cell; GSC, germline stem cell. (B) nos>Control RNAi (Ctrl KD) and nos>set1 RNAi (Set1 KD) flies were grown at 18°C until eclosion, and then shifted to 25°C for 0, 1, 3, 5 or 7 days. (C) Representative Ctrl KD and Set1 KD testes at the third instar larval stage (L3), day 0, 1, 3, 5 and 7 post-eclosion stained with the GSC lineage marker Vasa (green), Arm (red) or Fas III (red) for the hub area (white dashed outline), 1B1 for the spectrosome and fusome, and Tj (magenta) for the CySC lineage cells. Yellow dotted lines indicate overpopulated early germ cells. (D) Quantification of the percentage of testes with the representative germline phenotypes of germ cell loss (yellow) and early-germline overpopulation (red), present in Ctrl KD and Set1 KD testes at L3, as well as 0, 1, 3, 5 and 7 days post-eclosion. (E) Quantification of GSC number for Ctrl KD testes (L3: n=38; day 0: n=35; day 1: n=40; day 3: n=30; day 5: n=31; day 7: n=29) and Set1 KD testes (L3: n=47; day 0: n=51; day 1: n=34; day 3: n=33; day 5: n=40; day 7: n=39). See also Table S1. (F) Quantification of hub size for Ctrl KD and Set1 KD testes. See also Table S2. (G) Quantification of early cyst cell number for Ctrl KD and Set1 KD testes. See also Table S3. For E-G, individual data points and mean values are shown. Error bars represent s.e.m. ****P<10−4, ***P<10−3, **P<0.01, *P<0.05; n.s., not significant. Two-way ANOVA with interaction and Šidák multiple comparison test was used to compare two individual datasets with each other that have two independent variables. Scale bars: 20 μm.

