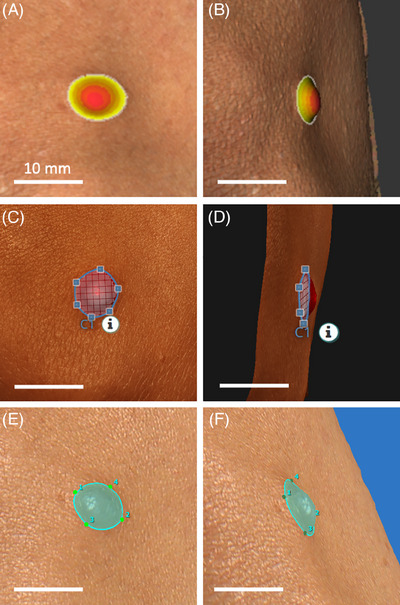
FIGURE 2.

Cutaneous neurofibroma analysis on different 3D imaging systems. (A, B) 3D model analysis using Cherry Imaging Trace software. (C, D) 3D model analysis using LifeViz App software. (E, F) 3D model analysis using Vectra software. Scale bars represent 10 mm.
