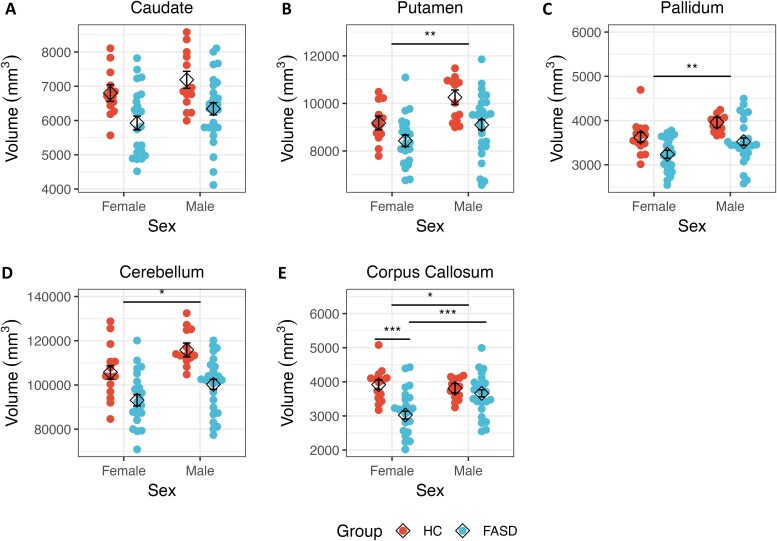
Figure 2.
Raw regional volumes plotted by sex for participants in the FASD and HC groups. Beeswarm plots representing each individual’s raw regional volume (in cubic millimetre), stratified by sex and group, are shown, overlaid by the estimated marginal means (diamond shape) from the linear regression model. There was no main effect of sex in (A) the caudate (P > 0.05). However, there was a main effect of sex within the (B) putamen, (C) pallidum and (D) cerebellum. In addition to a main effect of sex, the (E) corpus callosum additionally showed an interaction of group with sex. Error bars represent standard error of the estimated marginal mean. *P < 0.05; **P < 0.01; ***P < 0.001. FASD, Adults with fetal alcohol spectrum disorders; HC, Healthy comparison adults.

