Figure 3.
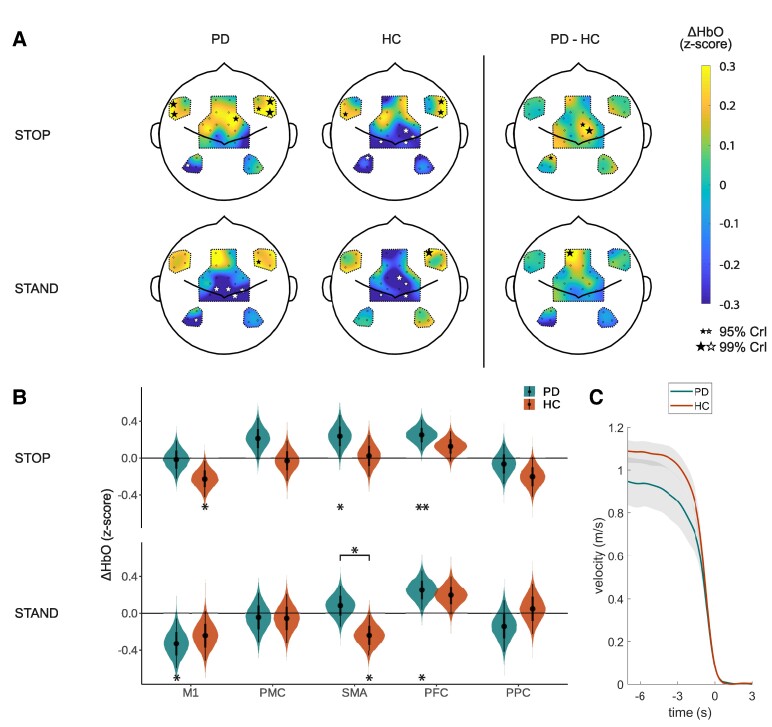
Stopping and standing. (A) Cortical activity maps of estimated ΔHbO responses 0–3 s after stopping (stop) and 7–10 s after stopping (stand) compared to baseline (−10 −5 s) as calculated by the Bayesian hierarchical model (NPD = 21, NHC = 22). The black and white stars indicate channels with 95% CrIs of the posterior probabilities excluding zero (small star) or 99% of the CrI excluding zero (large star). The size of the star scales with the probability that the estimated ΔHbO excludes zero. (B) Posterior probabilities of the estimated average ΔHbO responses for each ROI as calculated by the Bayesian hierarchical model (NPD = 21, NHC = 22). The stars underneath the violin plots indicate if the posterior probability of the estimated ΔHbO response is different from baseline; the stars above the violin plots indicate if the posterior probability of the estimated ΔHbO response differs between the groups (* = 95% CrI excluding zero; ** = 99% CrI excluding zero). (C) Average walking velocity for the two study groups when stopping (t = 0 s). The grey areas indicate the 95% confidence intervals. PD, Parkinson's disease group; HC, healthy control group; ΔHbO, change in oxygenated haemoglobin; CrI, credibility interval; ROI, region of interest; M1, primary motor cortex; PMC, premotor cortex; SMA, supplementary motor area; PFC, prefrontal cortex; PPC, posterior parietal cortex.

