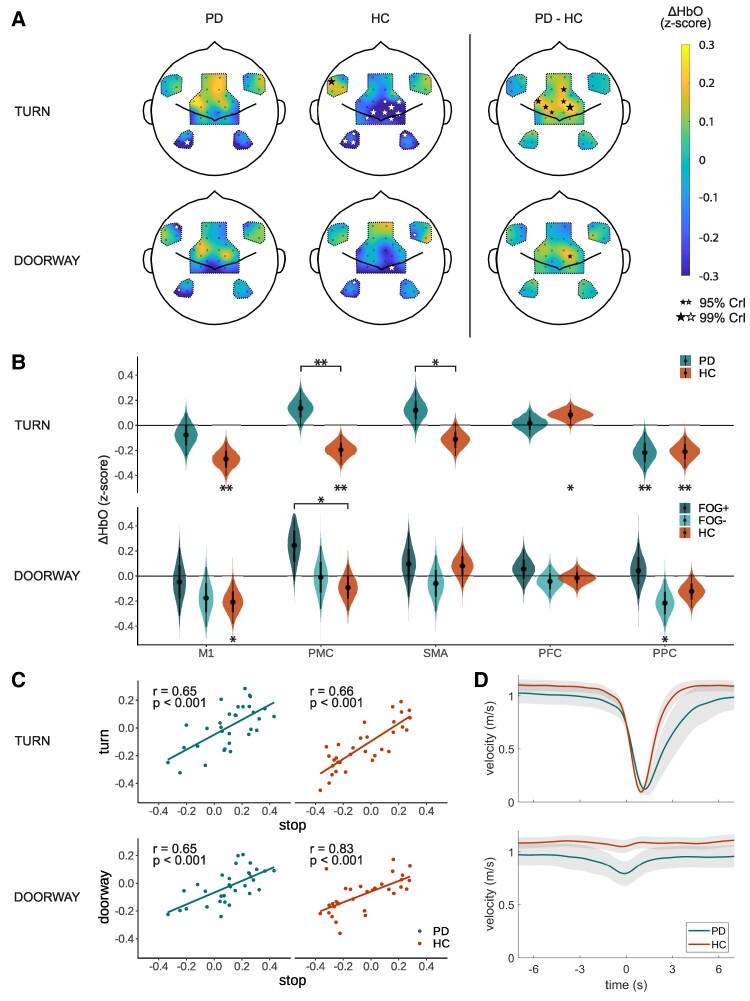
Figure 4.
Turns and doorways. (A) Cortical activity maps of estimated ΔHbO responses 0–3 s after turning and 0–3 s after doorway passing compared to baseline (−10 −5 s) as calculated by the Bayesian hierarchical model (turn, NPD = 16, NHC = 22; doorway, NPD = 22, NHC = 22). The black and white stars indicate channels with 95% CrI of the posterior probabilities excluding zero (small star) or 99% of the CrI excluding zero (large star). The size of the star scales with the probability that the estimated ΔHbO excludes zero. (B) Posterior probabilities of the estimated average ΔHbO responses for each ROI as calculated by the Bayesian hierarchical model (turn, NPD = 16, NHC = 22; doorway, NFOG+ = 10, NFOG− = 13, NHC = 22). The stars underneath the violin plots indicate if the posterior probability of the estimated ΔHbO response is different from baseline; the stars above the violin plots indicate if the posterior probability of the estimated ΔHbO response differs between the groups (* = 95% CrI excluding zero; ** = 99% CrI excluding zero). For the doorway condition, we present the subgroup analysis which the Parkinson’s disease group split into participants that experienced doorway freezing during the study (FOG+, n = 10, darker green) and that did not experience doorway freezing (FOG−, n = 13, lighter green). The original analysis is presented in Supplementary Fig. 5. (C) Correlations between the estimated cortical activity of each channel during stopping (x-axis) and during turns/doorways (y-axis). Each dot represents a different channel. Given statistics are based on the Pearson correlation coefficient (N = 32 channels). (D) Average walking velocity for the two groups when turning (upper plot) and when walking through the doorway (lower plot). The shaded areas indicate the 95% CrIs. Timepoint zero represents the onset of the turn/doorway passage. For abbreviations, see Fig. 3.

