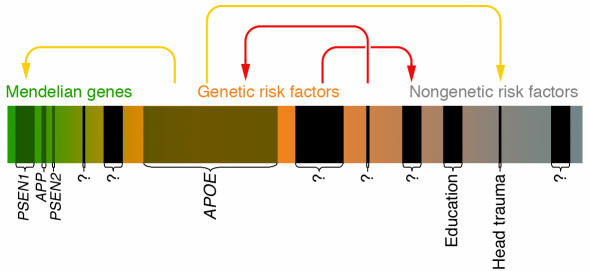
Figure 1.
This scheme depicts the risk spectrum predisposing to common diseases as one continuum, using AD as an example. The continuum extends from the most extreme genetic form (“Mendelian genes”; green) to cases influenced by genetic susceptibility factors (“Genetic risk factors”; orange), until reaching into a less well-defined area of cases that may be caused by genes of lesser penetrance/lower effect size and/or altogether nongenetic factors (“Nongenetic risk factors”; gray). Established Mendelian genes (APP, PSEN1, and PSEN2) or genetic risk factors (APOE-ε4) are represented by shaded boxes and represent the most obvious candidates of AD genetics; the width of these boxes approximately represents the relative contribution to the overall risk for disease. Black boxes indicate still-elusive disease genes/risk factors (“?”). Colored arrows indicate possible gene-gene and gene-environment interaction patterns: yellow arrows represent previously suggested interactions (e.g., between PSEN1 and APOE-ε4). Note that some interactions (red arrows) as well as the number of elusive genes are entirely hypothetical and are depicted for didactic purposes only.

