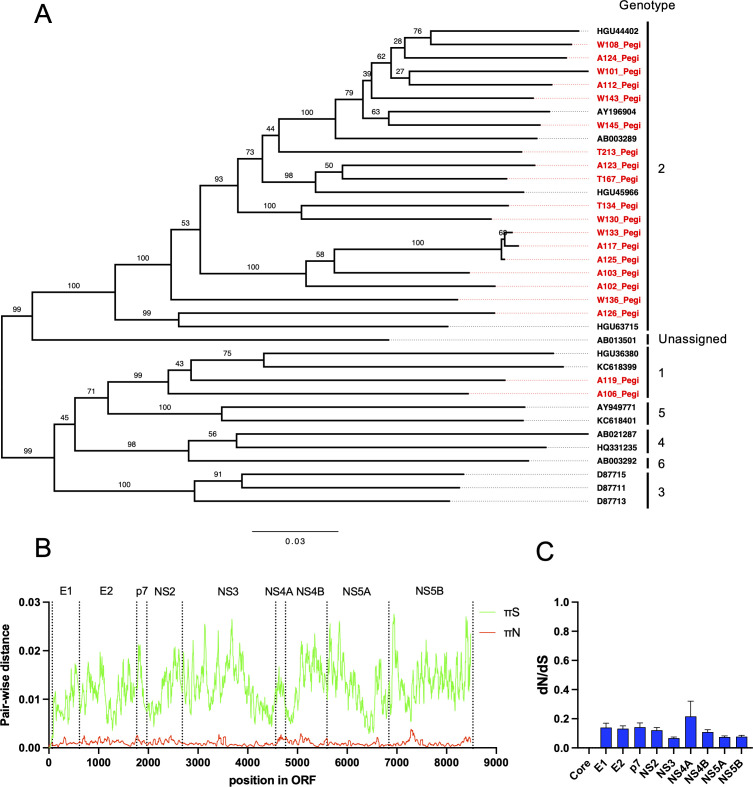
Fig 1.
Phylogenetic and selection analysis of the human pegivirus genome population. (A) Phylogenetic tree of full-length human pegivirus ORF sequences recovered from 20 HCV patients included in this study and relevant pegivirus reference sequences of genotypes 1–6. The tree is midpoint-rooted, and pegivirus genotypes are indicated at the tips. The scale bar depicts changes per site, and branch labels represent bootstrap support (n = 100). The prefix letters A, W, and T correspond to the three patient study groups defined in Materials and Methods. (B) New synonymous and non-synonymous π (pairwise distance) across the complete pegivirus ORF; the data are averaged for HPgV-1 recovered from the 18 out of 20 included HPgV-1/HCV coinfected patients (W101 and W130 were not included since they did not have sufficient coverage to be included, below 5,000 on average as seen in Table 1) in a sliding window of 15 amino acids. A junction of each predicted mature protein is indicated as vertical dotted lines with the protein label shown above. The small space between the translation start and E1 is considered the core region. (C) dN/dS ratios of each predicted mature pegivirus protein shown as averages of the HPgV-1 recovered from 18 out of 20 HPgV-1/HCV coinfected HCV patients (W101 and W130 were not included since they did not have sufficient coverage as stated above) with SEM depicted as error bars.

