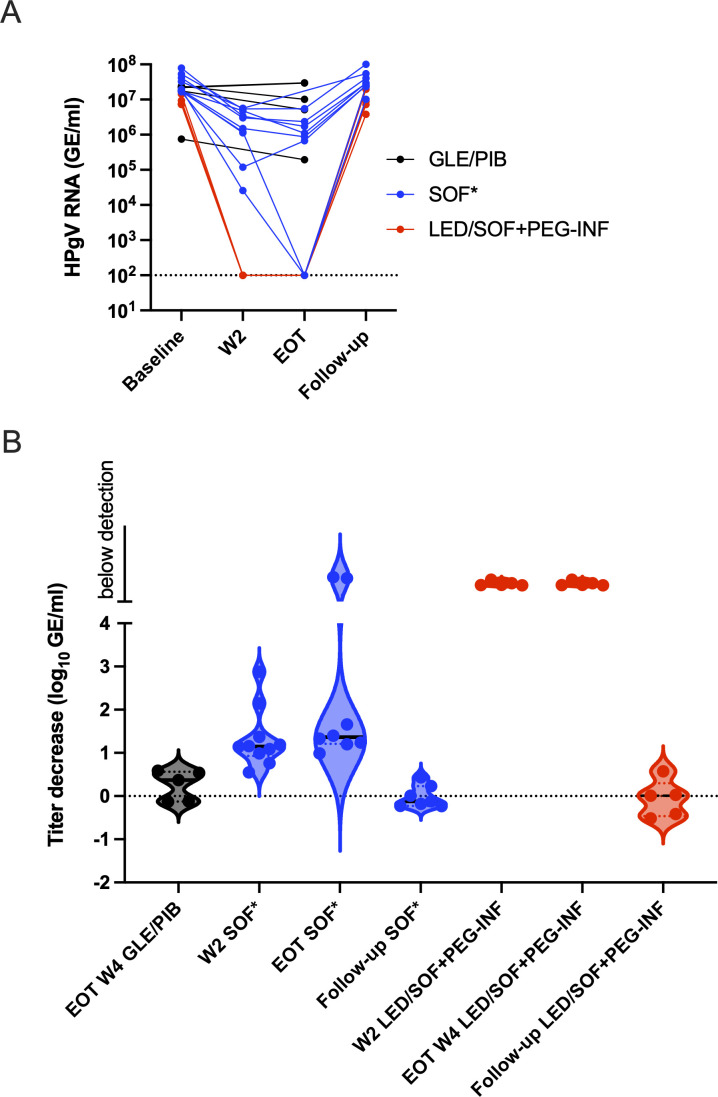
Fig 3.
Human pegivirus viremia development during treatment of HCV with DAA without or with sofosbuvir. (A) Individual patient HPgV-1 RNA titer in plasma shown as connected dots with timepoint indicated on the x-axis in SVR HCV patients during GLE/PIB treatment, HCV patients during sofosbuvir-containing treatment referred to as SOF*, including LED/SOF, VEL/SOF, VOX/VEL/SOF, GLE/PIB/SOF, and HCV patients during LED/SOF plus PEG-INF. (B) HPgV-1 RNA titer changes in treated patients compared to their respective baseline samples shown as log10 GE/mL drop on the y-axis and depicted as violin plots. Groupings are identical to (A).

