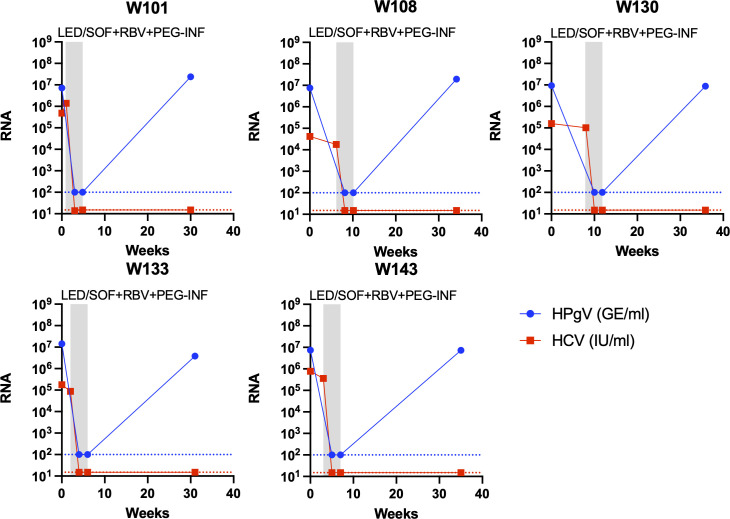
Fig 5.
Viremia development of HCV and HPgV-1 in HCV patients during treatment with a sofosbuvir and pegylated interferon-containing regimen. RNA titer measurements in plasma of HCV and HPgV-1 are shown at the y-axis as international units per milliliter (IU/mL) or genome equivalents per milliliter (GE/mL), respectively, and time at the x-axis. The gray boxes indicate periods during antiviral treatment with the type of treatment indicated at the top. Each panel represents a patient treated with LED/SOF plus RBV and PEG-INF. A red titer line representing HCV RNA at the y-axis represents undetectable HCV RNA titers (limit of detection 15 IU/mL). A blue titer line representing HPgV-1 RNA at the y-axis represents undetectable HPgV-1 RNA titers (limit of detection 100 GE/mL).

