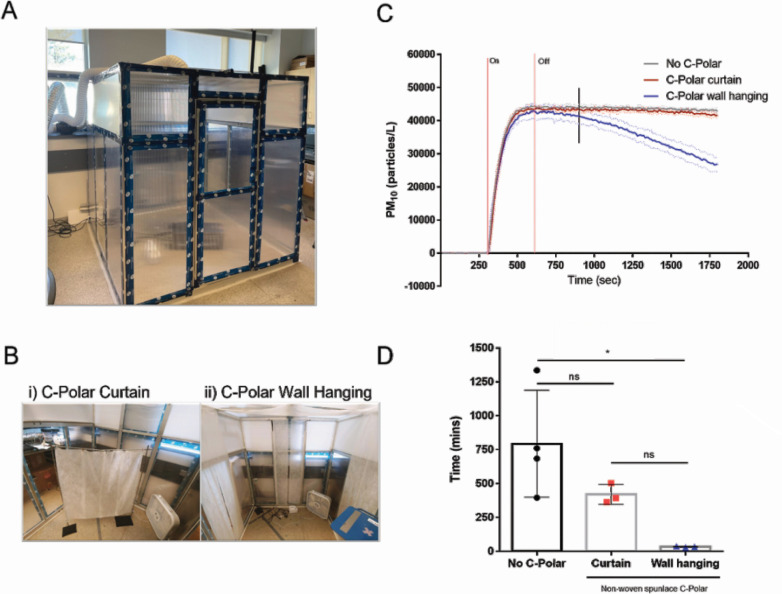
Fig 3.
Impact of C-POLAR static wall hanging on passive on airborne particles in an enclosed chamber. An enclosed clean chamber was constructed (1.71 m × 1.76 m × 1.90 m) with mixing ventilation (A). Mixing ventilation for the clean chamber (<0.5 ACH), (B, Photo i.) Single layer 6% C-POLAR-treated nonwoven spunlace curtain design (total surface area: 1.0 m2) (B, Photo ii.) Single layer 6% C-POLAR-treated nonwoven spunlace wall-hanging design and testing locations (total surface area: 5.04 m2). Average airborne particle concentrations normalized to their respective 5 min baseline average (PM10 = particles between 10 µm and 0.3 µm diameter) (SD = dotted line) (C). Particle source = PBS (154 mM NaCl). Nebulization time = 5 min (shown between two vertical red lines). Vertical black line indicates when decay was fitted. Calculated decay time determined by exponential curve fit (D). One-way ANOVA with Tukey’s multiple comparisons, α = 0.05.

