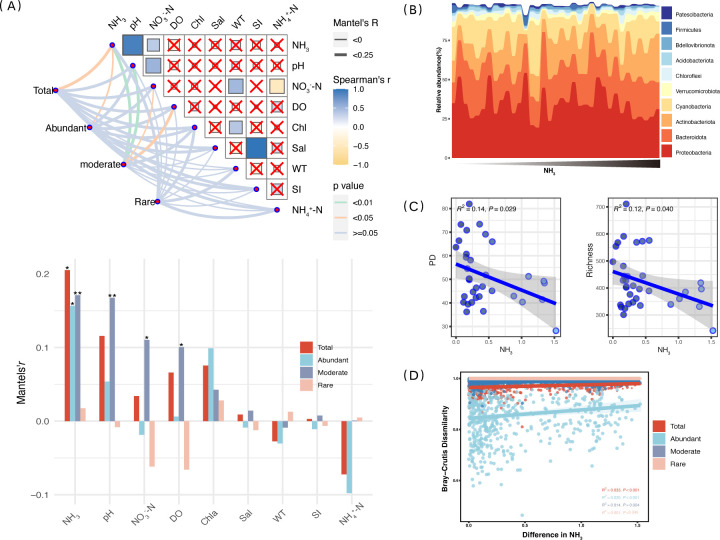
Fig 1.
Shifts in the diversity and composition of the microbial community under the NH3 stress. (A) Mantel test of environmental drivers of the microbial community and its subcommunities (*P < 0.05 and **P < 0.01). (B) Taxonomic composition of the microbial community at the phylum level under the NH3 gradient, only the top ten phyla. (C) Trends in the diversity of the microbial community with NH3. (D) Linear regression between the “Bray-Curtis” similarity distances of community and the Euclidean distances of NH3.

