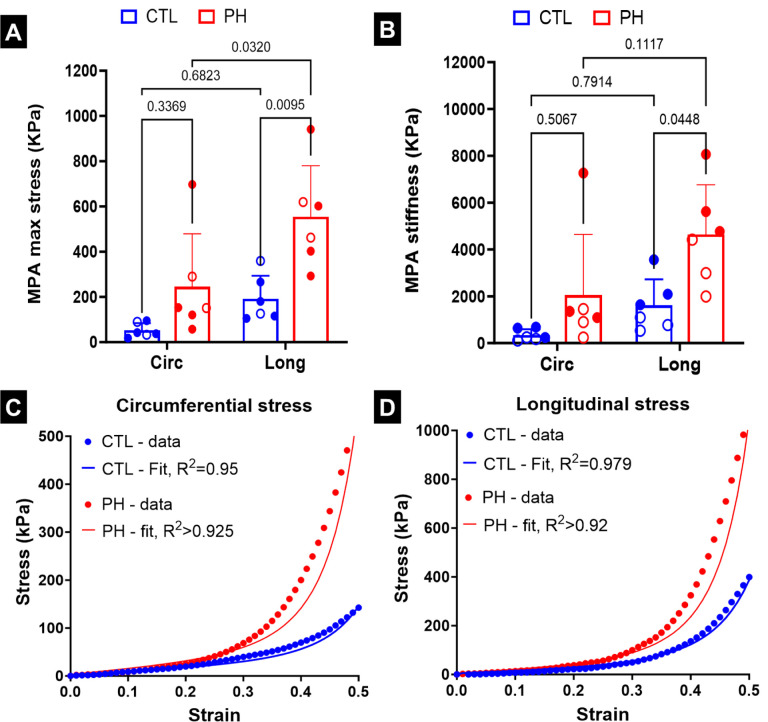
Fig. 4.
(A) Stress in the main pulmonary artery (MPA) during mechanical testing at 50% strain, (B) stiffness of the MPA at 50% strain. Mean stress-strain curve based on uniaxial testing of pulmonary arteries and fits based on non-linear artery model in (C) circumferential and (D) longitudinal directions. Statistics in (A), (B) were performed using 2-way ANOVA with Tukey’s correction for multiple comparisons. Male and female animals are denoted by filled and hollow markers, respectively. CTL: n=6, PH: n=6. Circ: circumferential, Long: longitudinal.

