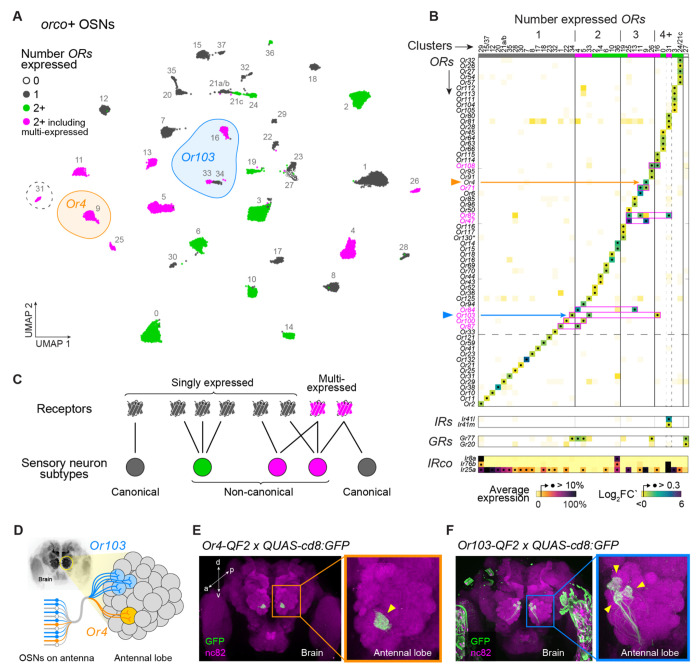
Figure 4. OR coexpression and multi-expression across orco+ olfactory neurons.
(A) Annotated UMAP showing reclustering of 28,807 nuclei assigned to orco+ OSN clusters in the original analysis (Fig. 1D). Dashed circle marks the only cluster (#31) that expressed ligand-specific IRs. (B) Differential expression of ligand-specific receptors across 37 major clusters. All ORs, IRs, and GRs with log2FC’ > 0.3 in any cluster are shown (see Fig. S15 for lower cutoff). Clusters expressing the same receptors were merged (#15/37, 21a/b, 24/21c). See Fig. S15 for log2FC’ and log average expression in all clusters examined separately. IR co-receptor expression shown at bottom as percent gene-specific maximum. Pink boxes highlight expression calls for multi-expressed ORs. (C) Schematic illustrating classification of receptors and OSN subtypes based on patterns of expression. (D) OSNs (bottom left) project axons to antennal lobe glomeruli (right) according to subtype. Data in (B) suggest that Or4 and Or103 are expressed in 1 and 3 OSN subtypes, respectively. (E–F) Antibody stainings show the GFP-expressing axons of Or4 (E) and Or103 (F) neurons in the adult female antennal lobe. Yellow arrowheads mark target glomeruli. See Methods for details.

