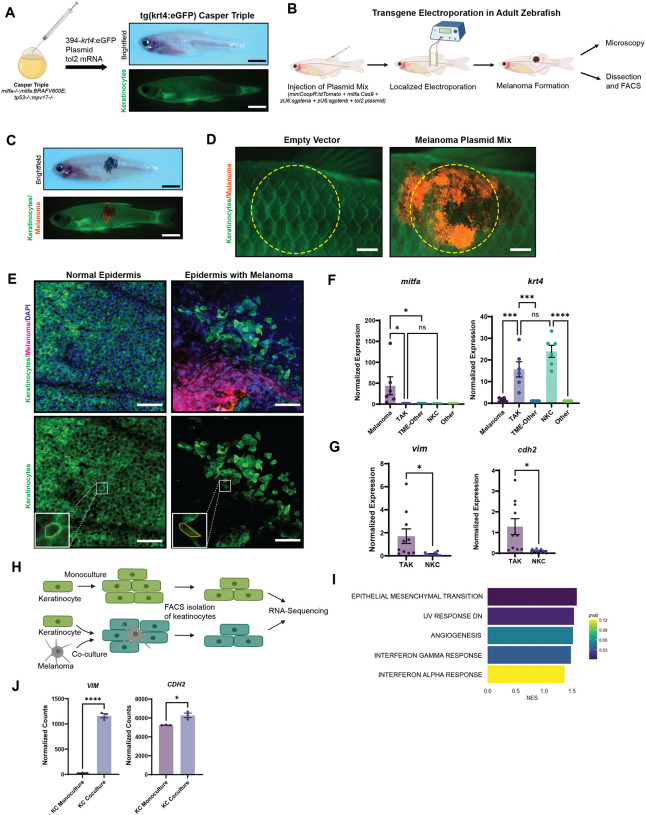
Figure 1. Keratinocytes in the melanoma microenvironment undergo EMT-like changes.
(A) Generation of transparent zebrafish with GFP-labeling of keratinocytes. Casper Triples (mitfa−/−;mitfa:BRAFV600E;tp53−/−;mpv17−/−) were injected with the Tol2Kit 394 vector containing a krt4:eGFP cassette and tol2 mRNA. Brightfield shows a transparent zebrafish while fluorescence imaging shows eGFP-labeling of keratinocytes. (Scale bar = 5mm)
(B) Schematic of TEAZ (Transgene Electroporation in Adult Zebrafish). Plasmid mix containing miniCoopR:tdTomato, mitfa:Cas9, zU6:sgptena, zU6:sgptenb, and the tol2 plasmid was injected superficially in the flank of the zebrafish. Electroporation of the injection site results in rescue of melanocyte precursors and the generation of a localized melanoma that could be analyzed by microscopy and FACS.
(C) Brightfield and immunofluorescence of zebrafish 8-weeks post-TEAZ with localized and fluorescently labeled melanoma. (Scale bar = 5mm)
(D) Immunofluorescence imaging of TEAZ region after 8-weeks, comparing empty vector control vs. miniCoopR:tdT conditions, with yellow dotted circles indicating general area of dissection for FACS. (Scale bar = 1mm)
(E) Confocal imaging of zebrafish epidermis. Normal epidermis of Tg(krt4:eGFP) Casper Triple post-TEAZ with empty vector control shows eGFP-labeled, polygonal shaped keratinocytes regularly connected while epidermis with melanoma generated with miniCoopR-drived melanocyte rescue shows disrupted epidermis and irregularly shaped keratinocytes. (Scale bar = 50um)
(F) qPCR of FACS sorted zebrafish epidermis with or without melanoma. tdTomato-labeled melanoma cells, eGFP-labeled keratinocytes and non-fluorescently labeled TME cells were isolated by dissection (as indicated in G) and FACS. Comparison of mitfa and krt4 expression of samples normalized to non-fluorescent cells, either ‘TME-Other’ in tumor samples or ‘Other’ in non-tumor samples, shows enrichment of mitfa in melanoma sample and krt4 in keratinocyte sample. ns is non-significant, * is p ≤ 0.05, *** is p ≤ 0.001, **** is p ≤ 0.0001 by Tukey’s multiple comparisons test.
(G) Comparison of the EMT-markers vim and cdh2 shows enrichment in TME keratinocytes vs. keratinocytes from epidermis without melanoma. * is p ≤ 0.05 by Welch’s t-test.
(H) Schematic of keratinocyte-melanoma co-culture experiment. HaCaTs were cultured in monoculture or co-culture with A375 melanoma cells in triplicates for 21 days, followed by FACS isolation of keratinocytes for RNA-sequencing comparing co-culture vs. monoculture keratinocytes.
(I) Top 5 enriched Hallmark pathways in HaCaTs co-cultured with A375 melanoma cells compared with HaCaTs in monoculture.
(J) Normalized counts of EMT biomarkers vimentin (VIM) and N-cadherin (CDH2).

