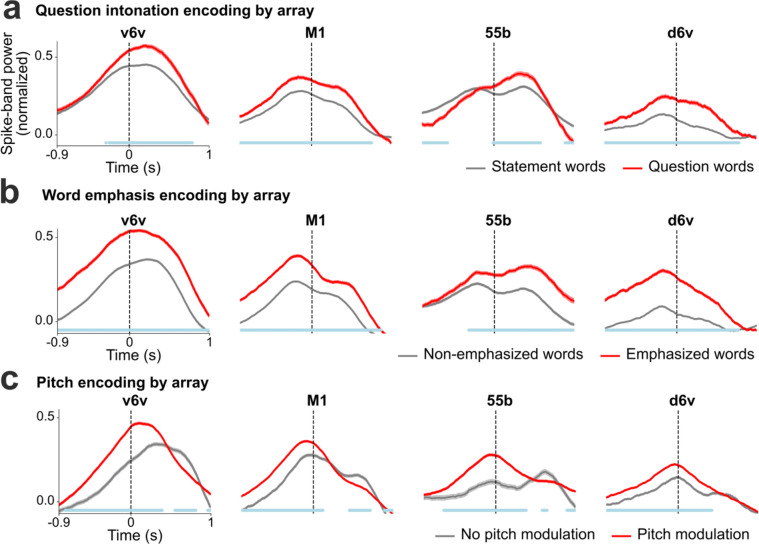
Extended Data Fig. 7: Paralinguistic features encoding recorded from individual arrays.
a. Trial-averaged spike-band power (mean ± s.e.), averaged across all electrodes within each array, for words spoken as statements and as questions. At every time point, the spike-band power for statement words and question words were compared using the Wilcoxon rank-sum test. The blue line at the bottom indicates the time points where the spike-band power in statement words and question words were significantly different (p<0.001, n1=970, n2=184). b. Trial averaged spike-band power across each array for non-emphasized and emphasized words. The spike-band power was significantly different between non-emphasized words and emphasized words at time points shown in blue (p<0.001, n1=1269, n2=333). c. Trial-averaged spike-band power across each array for words without pitch modulation and words with pitch modulation (from the three-pitch melodies singing task). Words with low and high pitch targets are grouped together as the ‘pitch modulation’ category (we excluded medium pitch target words where the participant used his normal pitch). The spike-band power was significantly different between no pitch modulation and pitch modulation at time points shown in blue (p<0.001, n1=486, n2=916).

