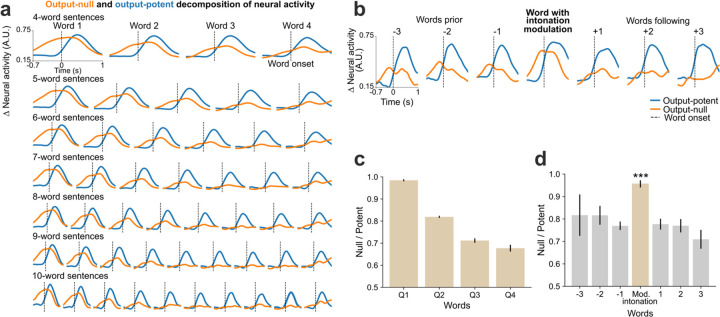
Fig. 4. Output-null and output-potent neural dynamics during speech production.
a. Average approximated output-null (orange) and output-potent (blue) components of neural activity during attempted speech of cued sentences of different lengths. Output-null activity gradually decayed over the course of the sentence, whereas the output-potent activity remained consistent irrespective of the length of the sentence. b. Average output-null and output-potent activity during intonation modulation (question-asking or word emphasis); data are trial-averaged aligned to the emphasized word (center) and the words preceding and/or following that word in the sentence. The output-null activity increased during pitch modulation as compared to the words preceding or following it. c. Panel a data are summarized by taking the average null/potent activity ratios for words in the first-quarter, second-quarter, third-quarter, and fourth-quarter of each sentence (mean ± s.e.). d. Panel b data are summarized by calculating average null/potent activity ratios of the intonation modulated word (beige) and the words preceding or following it (gray) (mean ± s.e.). The null/potent ratios of modulated words were significantly different from that of non-modulated words (Wilcoxon rank-sum, p= 10−21, n1=460, n2=922). Extended Data Fig. 10 shows these analyses for each array individually.

