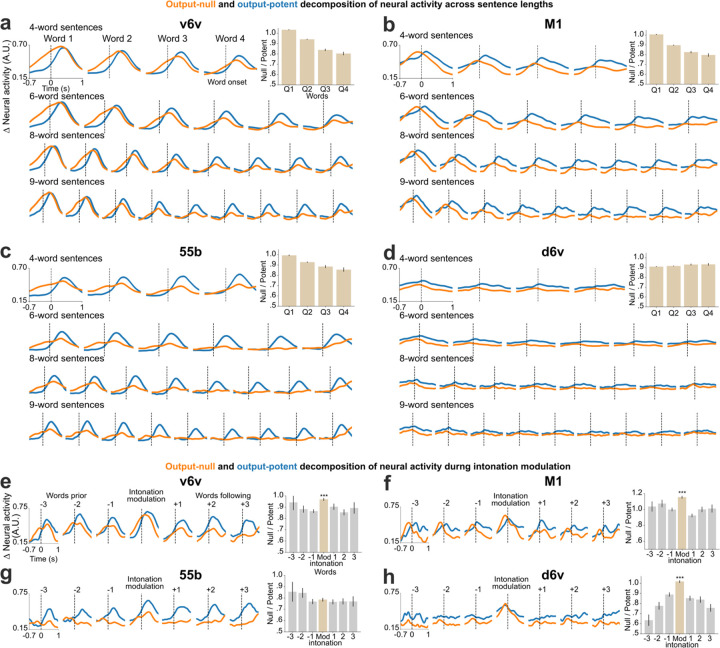
Extended Data Fig. 10: Output-null and output-potent neural dynamics during speech production in individual arrays.
a-d. Average approximated output-null (orange) and output-potent (blue) components of neural activity during attempted speech of cued sentences of different lengths. Here the neural components are computed for each array independently by training separate linear decoders (i.e., repeating the analyses of Fig. 4 for individual arrays independently). A subset of sentence lengths are shown in the interest of space. Note that the d6v array had much less speech-related modulation. Bar plots within each panel show a summary of all the data (including the not-shown sentence lengths) by taking the average null/potent activity ratios for words in the first-quarter, second-quarter, third-quarter, and fourth-quarter of each sentence (mean ± s.e.). e-h. Average output-null and output-potent activity during intonation modulation (question-asking or word emphasis) computed separately for each array. Output-null activity shows an increase during intonation modulated word in all arrays. Null/potent activity ratios are summarized in bar plots of intonation-modulated word (red) and the words preceding or following it (gray) (mean ± s.e.). The null/potent ratios of modulated words were significantly different from that of non-modulated words for the v6v, M1 and d6v arrays (Wilcoxon rank-sum, v6v: p= 10−11, M1: p= 10−16, 55b: p= 0.3, d6v: p= 10−26, n1=460, n2=922).

