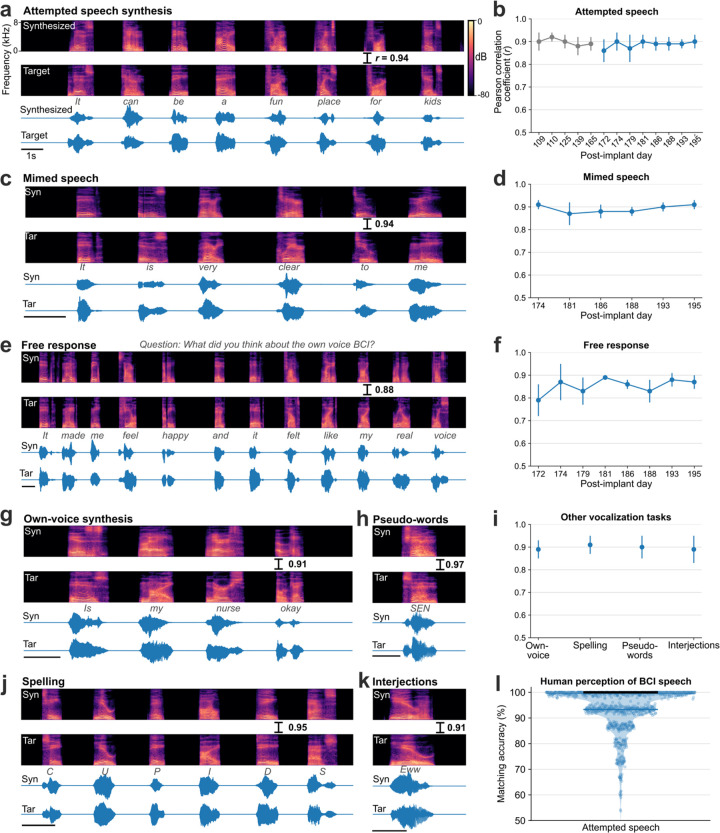
Fig. 2. Voice neuroprosthesis allows a wide range of vocalizations.
a. Spectrogram and waveform of an example trial showing closed-loop synthesis during attempted speech of a cued sentence (top) and the target speech (bottom). The Pearson correlation coefficient (r) is computed across 40 Mel-frequency bands between the synthesized and target speech. b. Pearson correlation coefficients (mean ± s.d) for attempted speech of cued sentences across research sessions. Sessions in blue were predetermined as evaluation sessions and all performance summaries are reported over these sessions. c. An example mimed speech trial where the participant attempted to speak without vocalizing and d. mimed speech Pearson correlations across sessions. e. An example trial of self-guided attempted speech in response to an open-ended question and f. self-guided speech Pearson correlations across sessions. g. An example personalized own-voice synthesis trial. h, j, k. Example trials where the participant said pseudo-words, spelled out words letter by letter, and said interjections, respectively. The decoder was not trained on these words or tasks. i. Pearson correlation coefficients of own-voice synthesis, spelling, pseudo-words and interjections synthesis. l. Human perception accuracy of synthesized speech where 15 naive listeners for each of the 956 evaluation sentences selected the correct transcript from 6 possible sentences of the same length. Individual points on the violin plot show the average matching accuracy of each evaluation sentence (random vertical jitter is added for visual clarity). The bold black line shows median accuracy (which was 100%) and the thin blue line shows the (bottom) 25th percentile.

