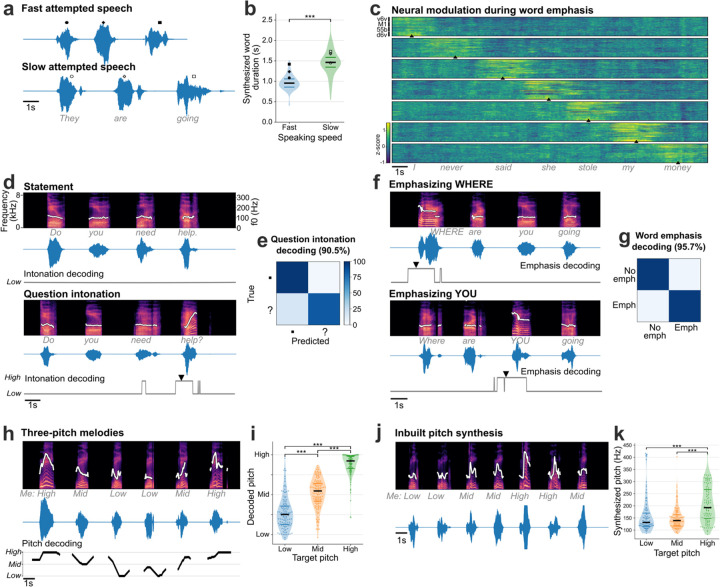
Fig. 3. Modulating paralinguistic features in synthesized voice.
a. Two example synthesized trials are shown where the same sentence was spoken at faster and slower speeds. b. Violin plots showing significantly different durations of words instructed to be spoken fast and slowly (Wilcoxon rank-sum, p=10−14, n1=72, n2=57). The bold black horizontal line shows the median value of the synthesized word duration and thin colored horizontal lines show the range between 25th and 75th percentiles. c. Trial-averaged normalized spike-band power (each row in a panel is one electrode) during trials where the participant emphasized each word in the sentence “I never said she stole my money”, grouped by the emphasized word. Trials were aligned using dynamic time warping and the mean activity across all trials was subtracted to better show the increased neural activity around the emphasized word. The emphasized word’s onset is indicated by the arrowhead at the bottom of each condition. d. Spectrograms and waveforms of two synthesized voice trials where the participant says the same sentence as a statement and as a question. The intonation decoder output is shown below each trial. An arrowhead marks the onset of causal pitch modulation in the synthesized voice. The white trace overlaid on the spectrograms shows the synthesized pitch contour, which is constant for a statement and increases during the last word for a question. e. Confusion matrix showing accuracies for closed-loop intonation modulation during real-time voice synthesis. f. Spectrograms and waveforms of two synthesized voice trials where different words of the same sentence are emphasized, with pitch contours overlaid. Emphasis decoder output is shown below. Arrowheads show onset of emphasis modulation. g. Confusion matrix showing accuracies for closed-loop word emphasis during real-time voice synthesis. h. Example trial of singing a melody with three pitch targets. The pitch decoder output that was used to modulate pitch during closed-loop voice synthesis is shown below. The pitch contour of the synthesized voice shows different pitch levels synthesized accurately for the target cued melody. i. Violin plots showing significantly different decoded pitch levels for low, medium and high pitch target words (Wilcoxon rank-sum, p=10−14 with correction for multiple comparisons, n1=122, n2=132, n3=122). Each point indicates a single trial. j. Example three-pitch melody singing synthesized by a unified brain-to-voice model. The pitch contour of the synthesized voice shows that the pitch levels tracked the target melody. k. Violin plot showing peak synthesized pitch frequency achieved by the inbuilt pitch synthesis model for low, medium and high pitch targets. Synthesized high pitch was significantly different from low and medium pitch (Wilcoxon rank-sum, p=10−3, n1=106, n2=113, n3=105). Each point shows an individual trial.

