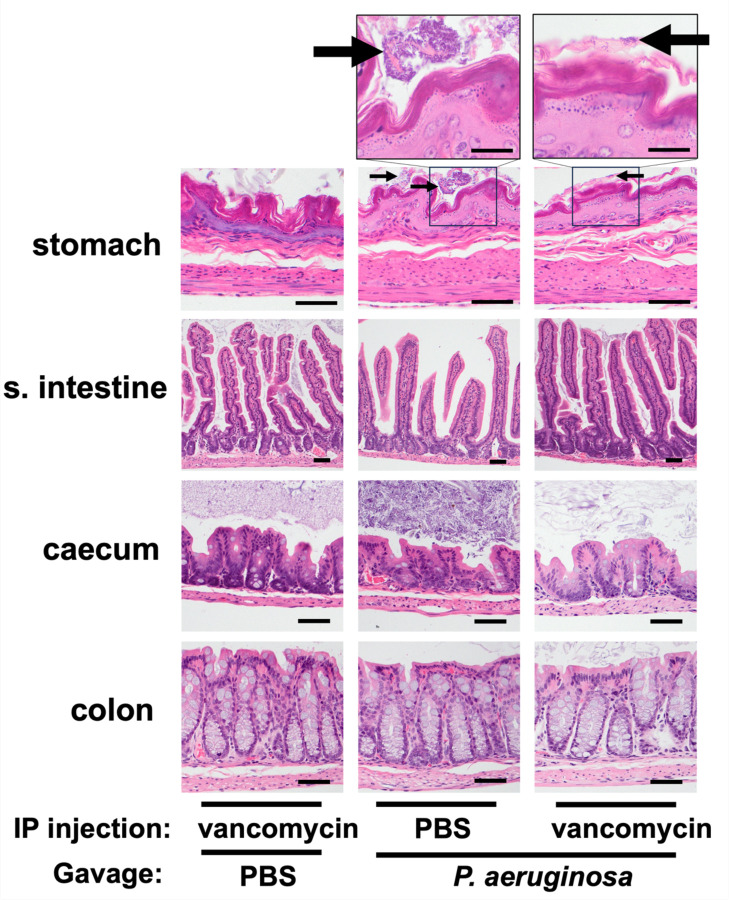
Figure 2: Tissue histology of the GI tracts of mice with carriage of P. aeruginosa.
Hematoxylin-eosin staining of organ tissues collected at day 3 post-inoculation with either 107.1 CFU of PABL048 or PBS (Mock). Prior to the orogastric gavage, mice received either vancomycin or PBS through intraperitoneal injections. Images in the bottom 4 rows were captured at a 400x magnification (bar = 100 µm). Images on the top row were captured at a 1,000x magnification (bar = 200 µm). (n = 3–4 mice/group). Arrows indicate intraluminal clumps of bacterial bacilli.

