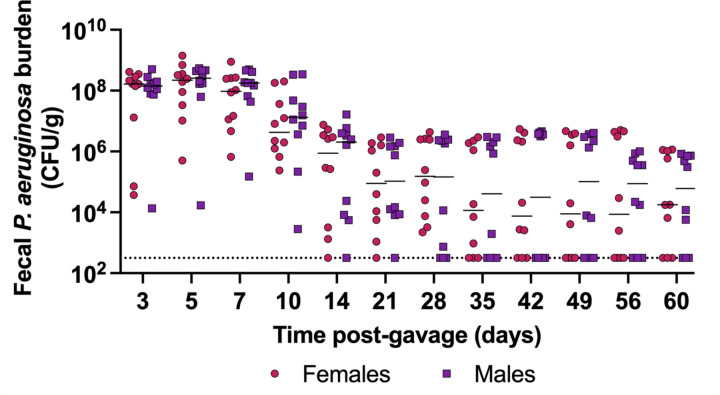
Figure 4: Long-term carriage of P. aeruginosa in the GI tract.
PABL048 fecal burdens after an orogastric gavage with 105.7+/-0.3 CFU in male (purple squares) and female (red circles) mice. The experiment was performed twice; combined results are shown (n = 10). Each symbol represents one mouse. Solid horizontal lines indicate medians. No significant differences were found between male and female mice at any time point (multiple t-tests). The dotted line indicates the limit of detection.

