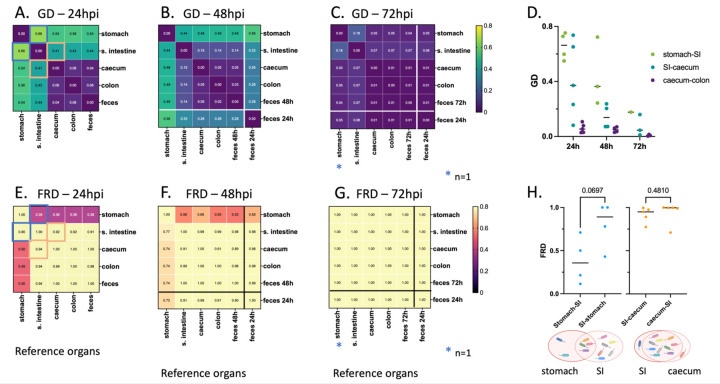
Figure 6: Average intra-mouse genetic relatedness of P. aeruginosa populations in the GI tract.
(A-C) Heatmaps representing the average intra-mouse genetic distances (GDs) of P. aeruginosa from organs of the mice described in figure 5, at (A) 24, (B) 48, and (C) 72 hpi. Lower values of GD (purple) indicate a higher frequency of barcode sharing between the samples, with 0 reflecting identical populations. (D) GD values over time between: stomach and small intestine (“SI”) (green), small intestine and caecum (teal), and caecum and colon (purple). Each symbol represents one mouse. Lines indicate medians. (E-G) Heatmaps representing the average intra-mouse Fractional Resilient Genetic Distances (FRD) of P. aeruginosa from organs of the mice described in figure 5, at (E) 24, (F) 48 and (G) 72 hpi. The FRD is calculated using the following formula: where RDA-B is the number of shared barcodes that contribute to genetic similarity between samples A and B. The column names in the FRD heatmaps correspond to the organ of reference (B in the above formula). High FRD values (yellow) indicate that most bacterial barcodes are shared between samples. Thick lines in panels B-C, F-G separate the samples collected at the time of dissection (top/left) from samples of feces collected from the same animals at an earlier time point (“feces 24h”) (bottom/right). Samples outlined by blue and orange squares in panels A and E indicate pairs that are detailed in panel H. (H) FRD values for bacteria from the stomach/small intestine (SI) (blue) and small intestine/caecum (orange) pairs at 24 hpi. Each symbol represents one mouse. Lines indicate medians. p-values are indicated (two-tailed paired t test). The Venn diagrams under the graph are visual representations of the averaged proportion of barcodes shared between two adjacent organs (circles). Diagrams created using Biorender.com. As observed in figure 5, no bacteria could be detected in the stomach of some mice, leading to variation in the number of samples used for this analysis: A, E, H: n = 5 (except for the stomach; n = 4), B, F: n = 4 (except for the stomach; n = 3), C, G: n = 3 (except for the stomach; n = 1), D: see panels A-C.

