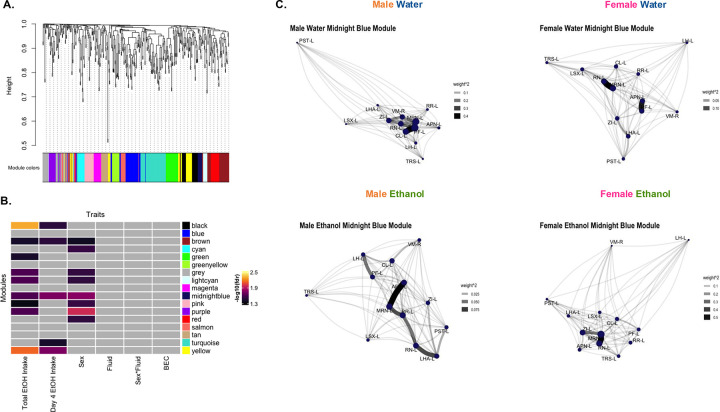
Figure 4. WGCNA identifies modules associated with sex and ethanol intake.
(A) WGCNA created with c-Fos expression [reduced, square root transformed density (cells/mm3); n=14–16/sex/fluid, 1 male water mouse excluded as an outlier]. Dendrogram clustering regions by module eigenregion values (MEs) and the module color for each region.
(B) Relationships between modules and traits. Total EtOH Intake (sum of ethanol intake on all 4 days) and day 4 ethanol (EtOH) intake was significantly correlated with MEs of ethanol drinking mice in several modules (Student’s asymptotic p-value, fdr <0.05). Sex was significantly associated with MEs of several modules (2-way ANOVA, fdr’s<0.05). Gray squares indicate non-significant p-values.
(C) Network graphs of relationship between regions in the midnight blue module in each sex and fluid group. Graphs created from adjacency matrices for each sex and fluid group. Node size denotes importance of node in network (larger nodes are hubs). Opacity and width of links denotes strength of connections. See Table S1 and S16 for further information.

